Distribution performance monitors – Brocade Network Advisor SAN + IP User Manual v12.3.0 User Manual
Page 510
438
Brocade Network Advisor SAN + IP User Manual
53-1003155-01
User-defined performance monitors
8
By default, ports display sorted by the Measure_Type value (Top ports sort from highest to
lowest and bottom ports sort lowest to highest). Click a column head to sort the columns by
that value.
•
Product — The product affected by this monitor.
•
Type — The type of port (for example, U-Port).
•
Identifier — The port identifier.
•
Port Number — The port number.
•
State — The port state (for example, Enabled).
•
Status — The port status (for example, Up).
•
Refreshed — The time of the last update for the monitor.
To configure a port performance monitor, refer to
“Configuring a user-defined port performance
Accessing additional data from top or bottom port monitors
•
(SAN ports) In a Top N or Bottom N monitor, double-click a row or right-click a row and select
Show Graph/Table to navigate to the Custom: Historical Performance Graph dialog box for the
selected measures. For more information, refer to
“Generating and saving a historical
•
(IP ports) In a Top N or Bottom N monitor, double-click a row or right-click a row and select
Show Graph/Table to navigate to the Historical Graphs/Tables dialog box for the selected
measures. For more information, refer to
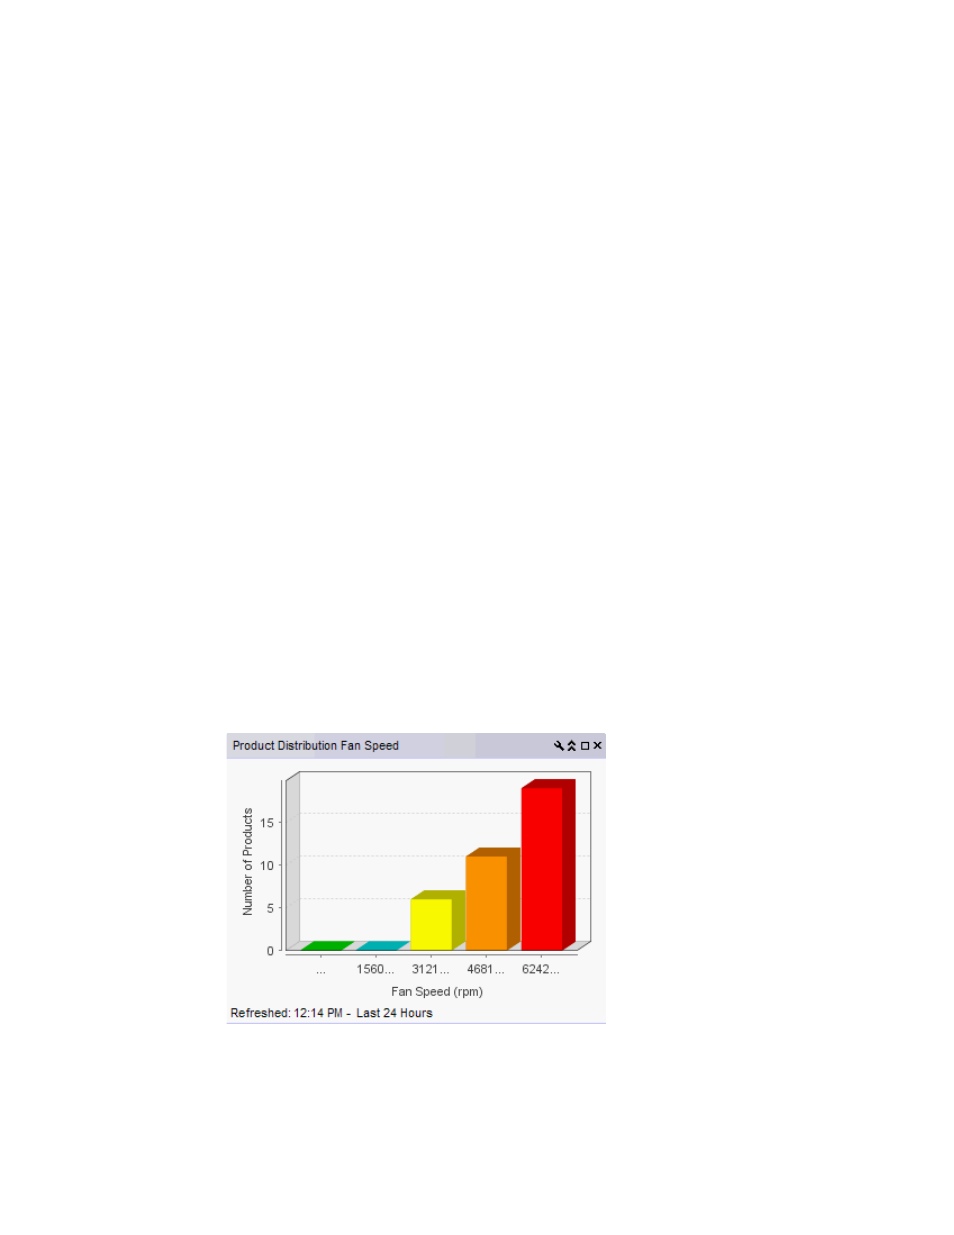
Distribution performance monitors
The distribution performance monitor (
) displays the distribution (number) of products or
ports for each of the five percentage ranges defined for the selected measure in a bar graph.
FIGURE 194
Distribution performance monitor example
The distribution performance monitor includes the following data:
•
Monitor title — The user-defined monitor title.