Events widget – Brocade Network Advisor SAN + IP User Manual v12.3.0 User Manual
Page 340
268
Brocade Network Advisor SAN + IP User Manual
53-1003155-01
Dashboard customization
7
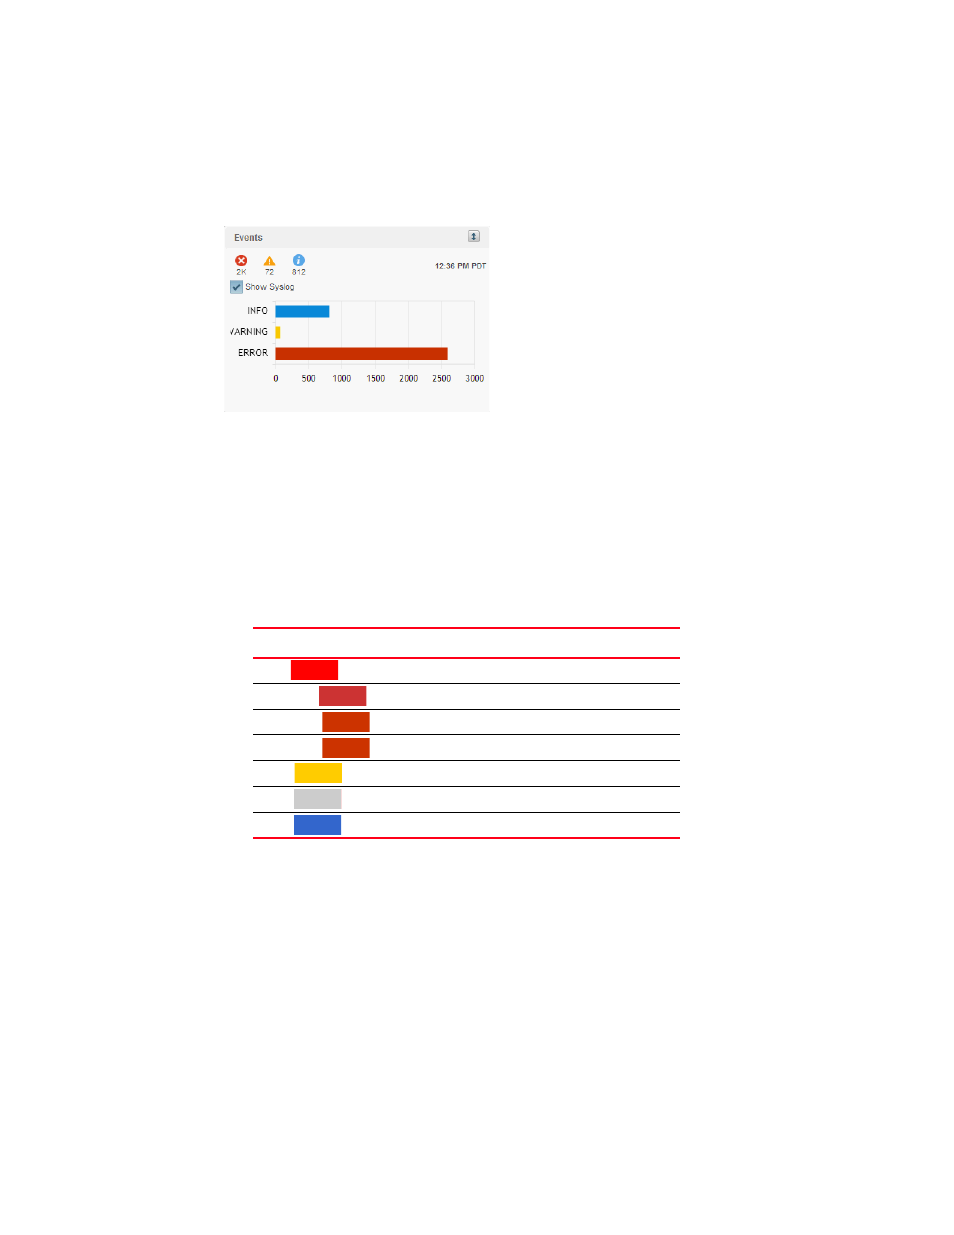
Events widget
The Events widget (
Figure 100
) displays the number of events by severity level for a specified time
range as a stacked bar graph.
FIGURE 100
Events widget
The Events widget includes the following data:
•
Widget title — The name of the widget.
•
Widget summary — The product count for each status (worst to best order) with the associated
icon displays underneath the widget title.
•
Show Syslog check box — Select to include Syslog information (default) on the Event Summary.
•
Bar chart — The event severity using the color-codes in
Table 27
.
The Events widget only includes events from products that are in your AOR. Double-click a bar
in the graph to navigate to the Events page with only the selected event type (Emergency, Alert,
and so on) displaying. For example, double-click the Error event bar. The Events page displays
with only Error events in the table. Fore more information about the Events page, refer to
The x-axis represents the number of occurrences of a particular event severity during the
selected time period. If you pause on a bar, a tooltip shows the number of events with that
severity level during the selected time period. Also, for each severity, the cumulative number of
traps, application events, and security events is reported next to the horizontal bar. If Syslog
messages are included, then they are included in the count. To conserve space, the number is
shown as is or truncated to the nearest 1,000("K") or 1,000,000("M").
TABLE 27
Event severity color codes
Color
Severity
Red
(
)
Emergency
Brick Red
(
)
Alert
Brick Red
(
)
Critical
Brick Red
(
)
Error
Gold
(
)
Warning
Grey
(
)
Notice
Blue
(
)
Info