Maps events, Viewing maps events, Maps events 3 – Brocade Network Advisor SAN + IP User Manual v12.3.0 User Manual
Page 2105

Brocade Network Advisor SAN + IP User Manual
2033
53-1003155-01
MAPS events
50
MAPS events
Once you configure MAPS rule violations to trigger RASLOG messages, the Management
application starts receiving SNMP traps for the MAPS rule violations. The Management application
processes the RASLOG messages by an event processor and displays them in the Master Log and
the historical graphs and monitors the same as any other events.
The event processor also receives dashboard change events in the form of traps from the switch for
all rule violations whether you configure the rule to trigger a RASLOG action or not. The
Management application uses these notifications internally to process and persist MAPS violations
information. These notifications also display in the Master Log and historical graphs and monitors
although they may not be seen in the switch RASLOG.
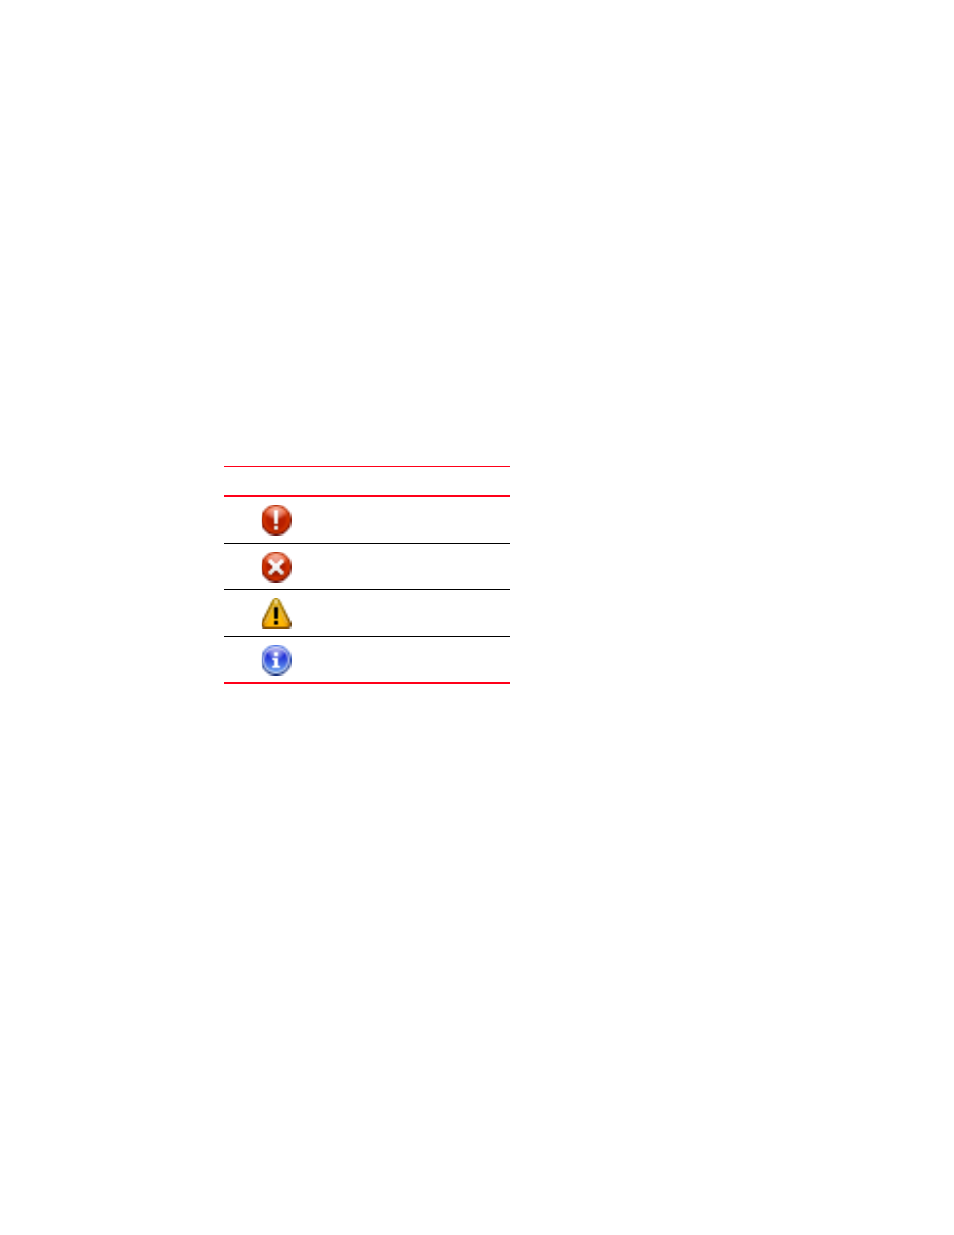
You can determine event severity by the event icons that display on the historical graphs and
monitors and Master Log. The following table lists the event icons that display on the historical
graphs and monitors and Master Log. For more information about events, refer to the
Viewing MAPS events
MAPS events allows you to view the events that occur before and after a violation. You can display
Master Log events for all MAPS violations at the product level. Port violations display Master Log
events at the product level only.
1. Right-click a device in the Product List or Connectivity Map and select Fabric Vision > MAPS >
Violations.
The Violations dialog box displays.
2. Display data for a specific duration by selecting one of the following options from the Range
list:
•
30 Minutes (default) — Displays data for the previous half hour beginning when the
Violations dialog box is displayed.
•
1 Hour — Displays data for the previous hour beginning when the Violations dialog box is
displayed.
•
6 Hours — Displays data for the previous 6 hours beginning when the Violations dialog box
is displayed.
•
12 Hours — Displays data for the previous 12 hours beginning when the Violations dialog
box is displayed.
Event Icon
Description
Critical
Error
Warning
Informational
