Generating a real-time performance graph – Brocade Network Advisor SAN + IP User Manual v12.3.0 User Manual
Page 1681
Brocade Network Advisor SAN + IP User Manual
1609
53-1003155-01
SAN real-time performance data
43
NOTE
Virtual Fabric logical ISL ports are not included in performance collection.
•
Choose to display the same Y-axis range for both the Tx MB/Sec and Rx MB/Sec measure
types for easier comparison of graphs.
Generating a real-time performance graph
You can monitor the device performance through a performance graph that displays transmit and
receive data. The graphs can be sorted by the column headers. You can create multiple real-time
performance graph instances.
NOTE
To make sure that statistics for a switch do not fail, you must configure SNMP credentials for the
switch. For step-by-step instructions, refer to
To generate a real-time performance graph for a device, complete the following steps.
1. Select the fabric, device, or port for which you want to generate a performance graph.
Right-click and select Performance > Real-Time Graph/Table or select Monitor > Performance
> Real-Time Graph. The Real Time Graphs/Tables dialog box displays.
If you selected a port, the Real Time Performance Graphs dialog box for the selected port
displays. To filter real-time performance data from the Real Time Performance Graphs dialog
box, refer to
“Filtering real-time performance data”
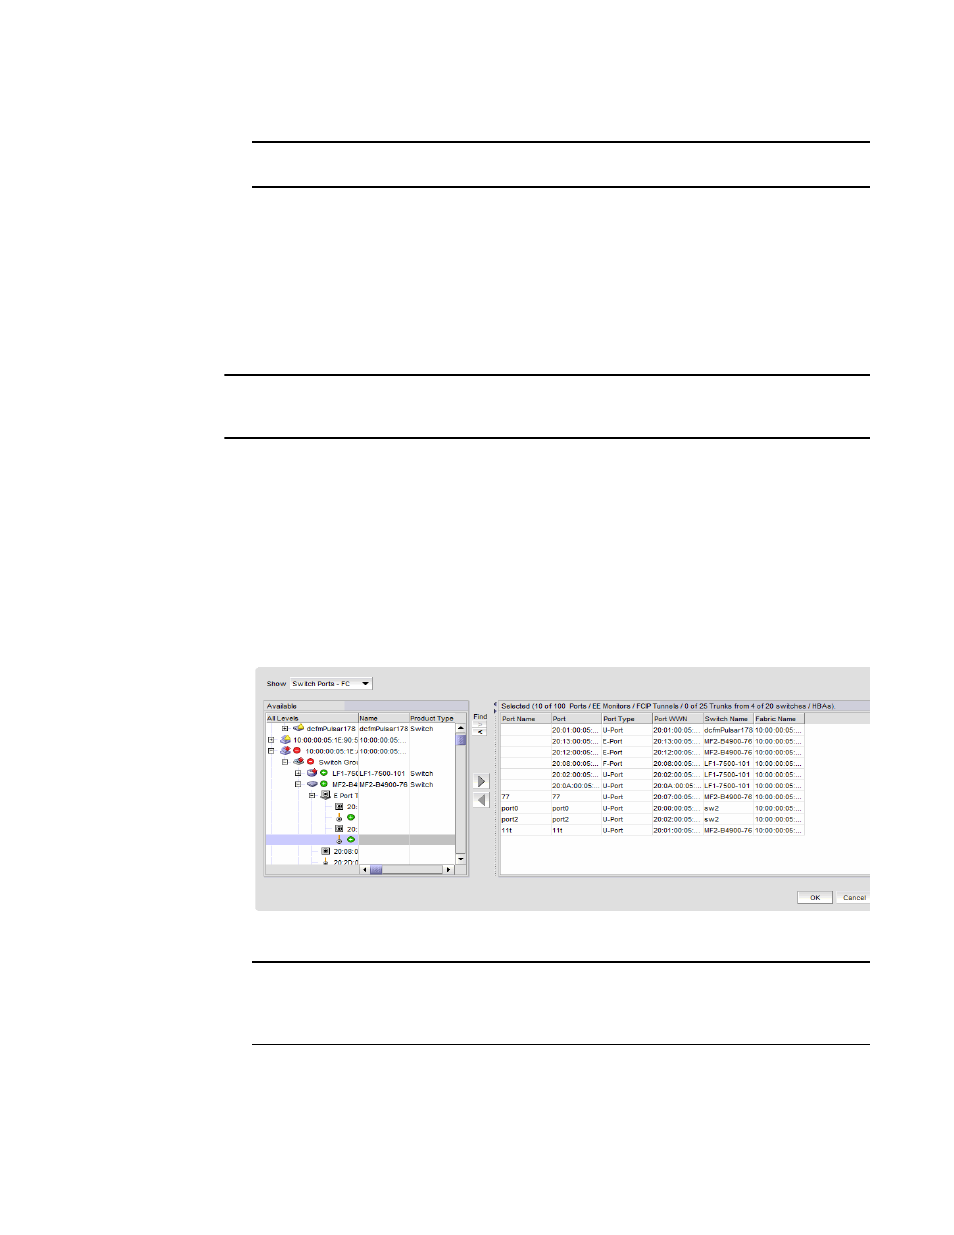
If you selected a fabric or a device, the Realtime Port Selector dialog box displays, as shown in
FIGURE 725
Realtime Port Selector dialog box
NOTE
You can set columns in the right side of the dialog box for FICON display using Server > Options
> SAN Display. The first eight columns will display FC Address, Serial #, Tag, Product Type,
Model, Vendor, Port Name, Port Type, and Port WWN.
If you selected a host adapter, the Realtime Port Selector - Hosts dialog box displays with all
the managed HBA and CNA ports of the discovered hosts, as shown in
. Continue
with
step 3
.