Figure 164 – Brocade Network Advisor SAN + IP User Manual v12.3.0 User Manual
Page 457
Brocade Network Advisor SAN + IP User Manual
385
53-1003155-01
Status widgets
8
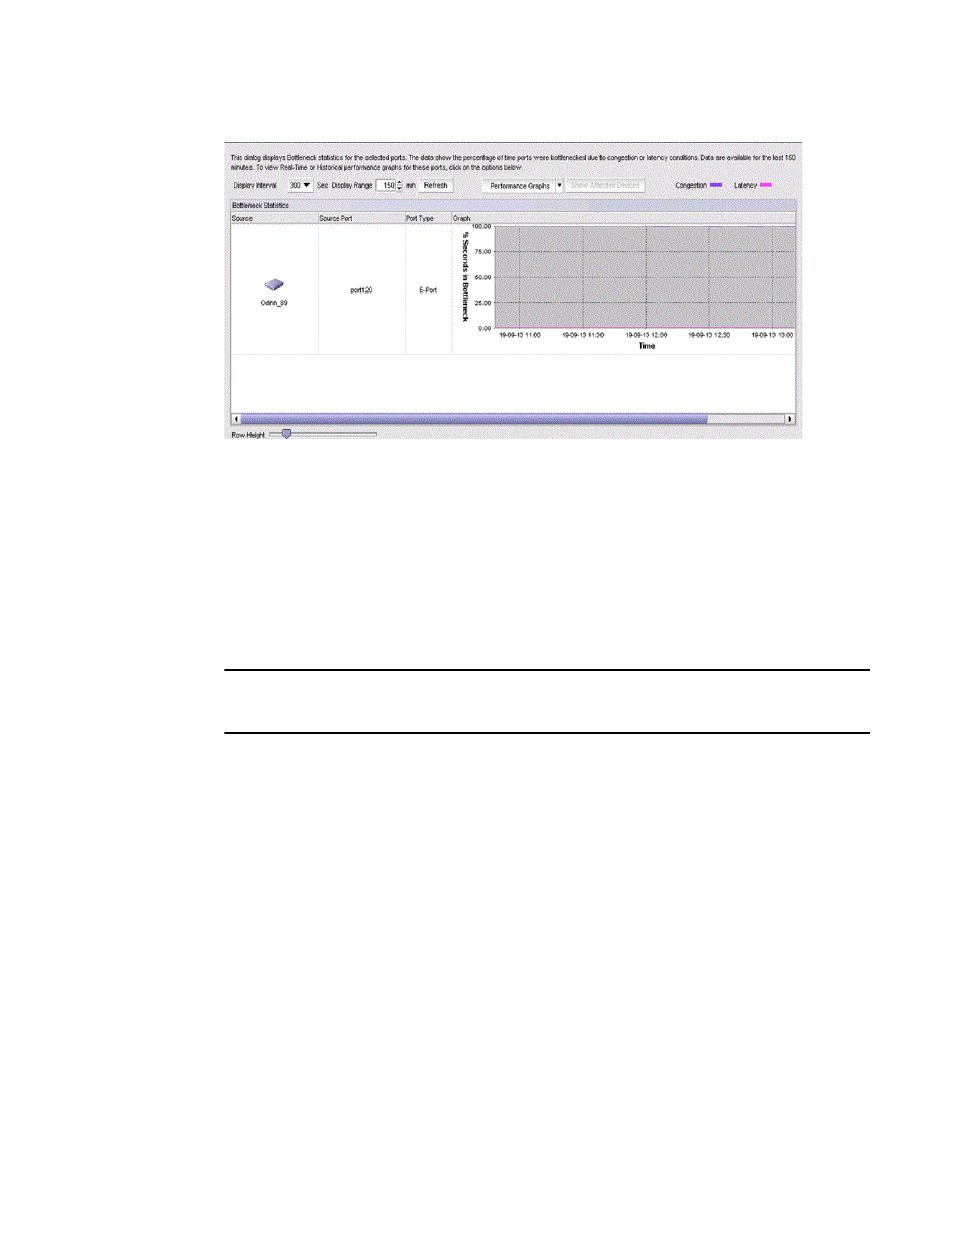
FIGURE 164
Bottleneck Graph dialog box
The Bottleneck Graph dialog box displays event information for a specific duration by selecting one
of the following from the time period:
•
If the dashboard time period is 30 minutes, then the Display Range is 30 minutes and the
Display Interval is 60 seconds.
•
If the dashboard time period is one hour, then the Display Range is 60 minutes and the Display
Interval is 300 seconds.
•
If the dashboard time period is greater than one hour, then the Display Range is 150 minutes
and the Display Interval is 300 seconds.
NOTE
On launching the graph, for SIM ports that are running on Fabric OS 7.2.0 or earlier, an error
message displays.