Performance integration with flow vision, Ormance graph, Monitoring flows using a performance – Brocade Network Advisor SAN + IP User Manual v12.3.0 User Manual
Page 1890: Graph, Monitoring flows using a performance graph

1818
Brocade Network Advisor SAN + IP User Manual
53-1003155-01
Flow Vision interoperability with other features
44
Performance integration with Flow Vision
You can use the performance graphs (historical or real-time) to monitor flows.
For platforms running Fabric OS 7.2 or later, Flow Vision replaces Top Talker and End-to-End
monitoring.
Monitoring flows using a performance graph
1. Select Monitor > Fabric Vision > Flow > Monitor.
The Flow Vision dialog box displays.
2. Select a row in the Flows list.
3. Select Performance Graph > Historical Graph or Real-Time Graph.
You can also access performance graphs directly from the main menu (Monitor > Fabric Vision
> Flow > Historical Graph or Real-Time Graph) or a shortcut menu (right-click a device or port
and select Fabric Vision > Flow > Historical Graph or Real-Time Graph).
If you select Real-Time Graph using a port that does not have any flows, the following message
displays: “There are no active flows with the monitor feature. Do you want to creates a flow for
the selected port?”. Click OK to create a flow for the selected port. For instructions, refer to
“Creating a Flow Monitor flow definition”
“Creating a Flow Generator flow
“Creating a Flow Mirror flow definition”
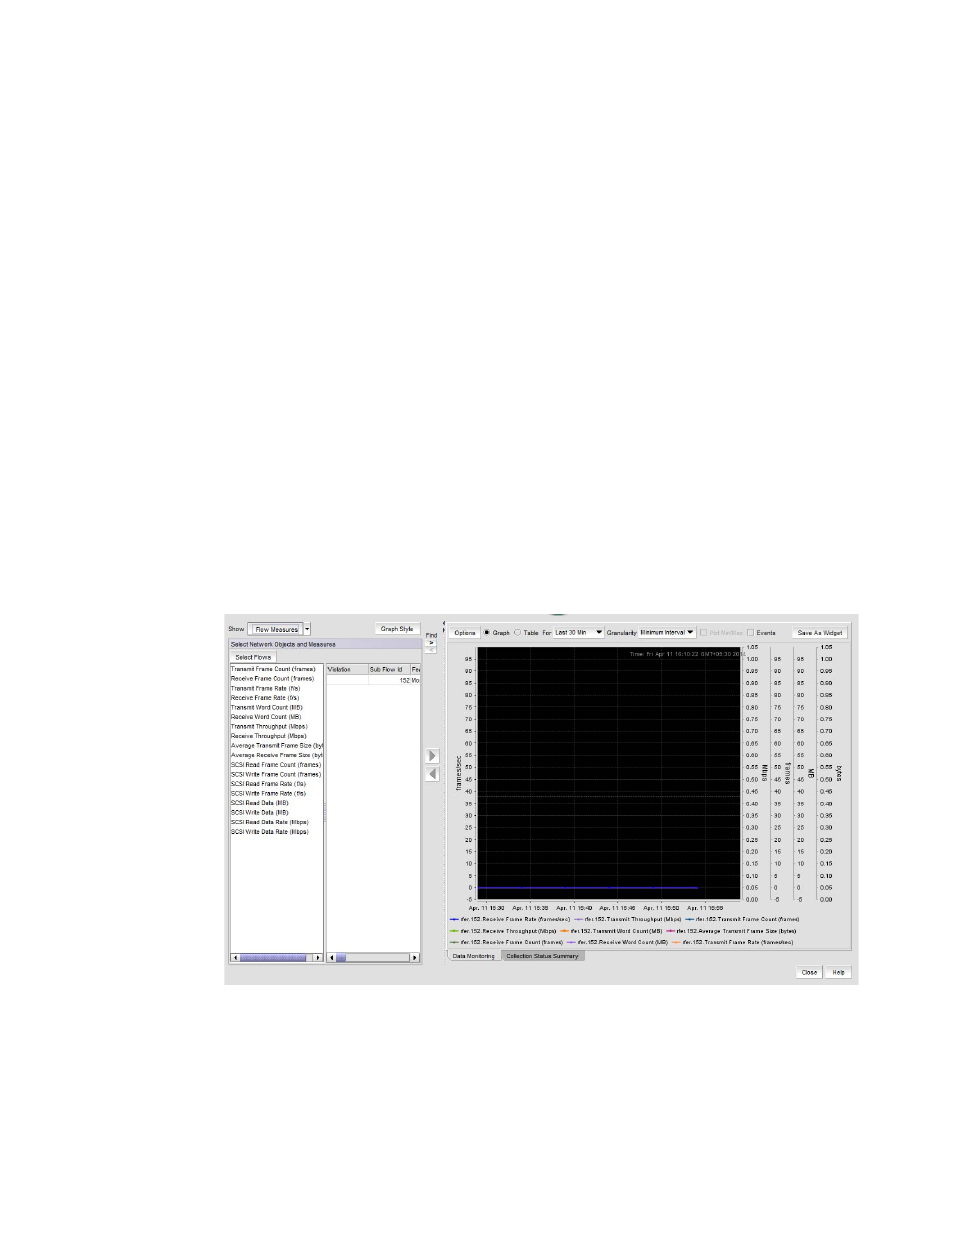
The Historical or Real Time Graphs/Tables dialog box displays.
FIGURE 817
Historical Graph (Flow Measures selected)
4. Select Flows or Flow Measures from the Shows list.
When you select Flows, the tree structure shows flows for the selected device. When you select
Flow Measures, the tree structure shows the measures associated with the selected flow.
