Top product memory utilization monitor – Brocade Network Advisor SAN + IP User Manual v12.3.0 User Manual
Page 375
Brocade Network Advisor SAN + IP User Manual
303
53-1003155-01
Dashboard customization
7
•
Product — The product affected by this monitor. Click to launch the Product page for this
device (refer to
on page 316). When you launch the Port page,
the detailed view closes.
•
Min — The minimum value of the measure in the specified time range.
•
CPU Utilization Percentage — The CPU utilization percentages.
•
Max — The maximum value of the measure in the specified time range.
•
Fabric — The fabric to which the device belongs.
•
Product Type — The type of product (for example, switch).
•
State — The product state (for example, Offline).
•
Status — The product status (for example, Reachable).
•
Tag — The product tag.
•
Serial # — The serial number of the product.
•
Model — The product model.
•
Port Count — The number of ports on the product.
•
Firmware — The firmware level running on the product.
•
Location — The location of the product.
•
Contact — A contact name for the product.
2. Click the close (X) button.
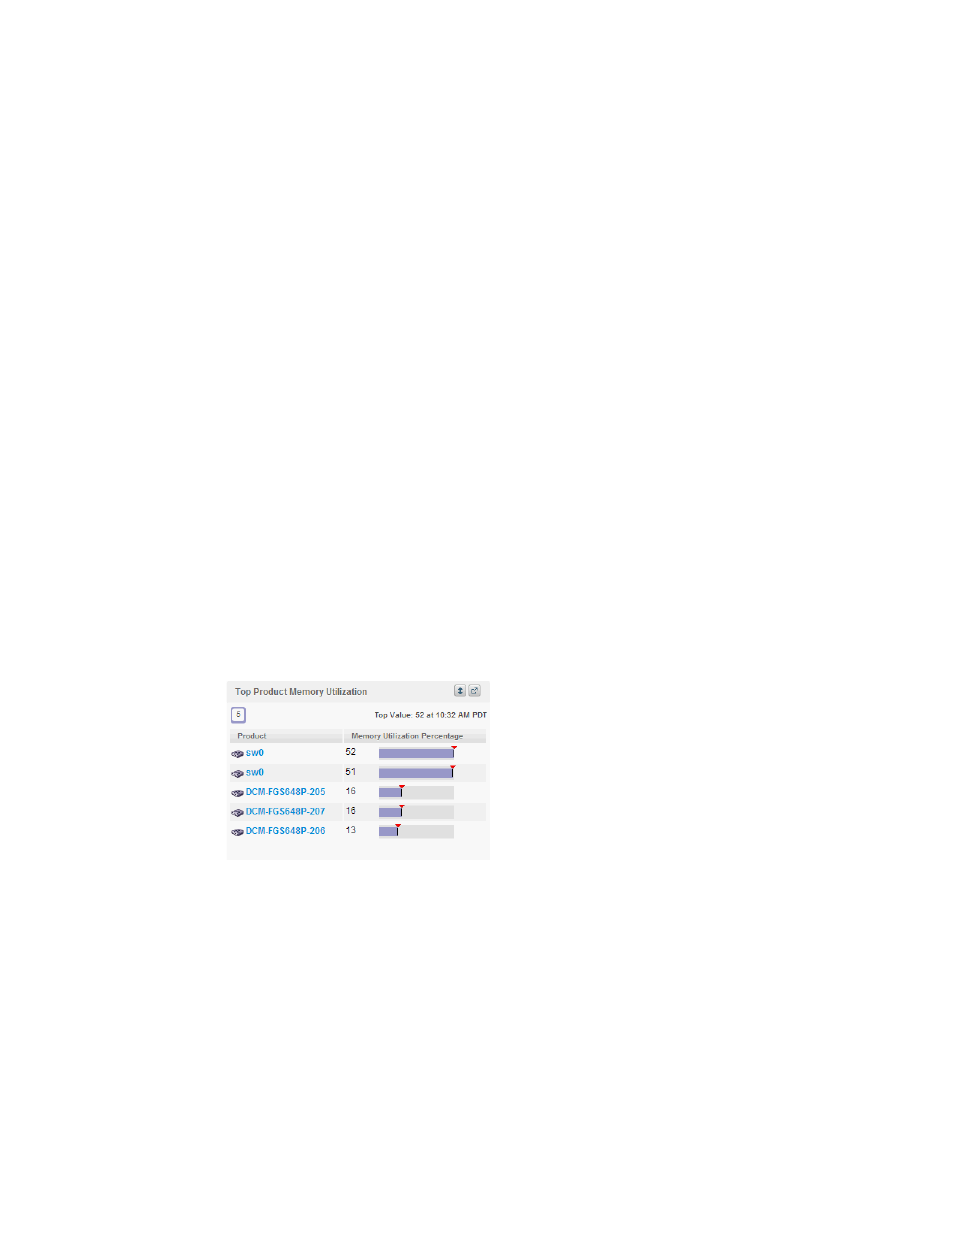
Top Product Memory Utilization monitor
The Top Product Memory Utilization monitor (
Figure 114
) displays the top product memory
utilization percentages in a table.
FIGURE 114
Top Product Memory Utilization monitor
The Top Product Memory Utilization monitor includes the following data:
•
Widget title — The name of the widget.
•
View Details icon — Click to launch the Detailed View page.
•
Widget summary — The product count for each status (worst to best) displays underneath the
widget title.
•
Top value — The top value and the time that value was reported.
•
Product — The product affected by this monitor. Click to launch the Product page for this device
(refer to
on page 316). When you launch the Product page, the
detailed view closes.