Top product response time monitor – Brocade Network Advisor SAN + IP User Manual v12.3.0 User Manual
Page 377
Brocade Network Advisor SAN + IP User Manual
305
53-1003155-01
Dashboard customization
7
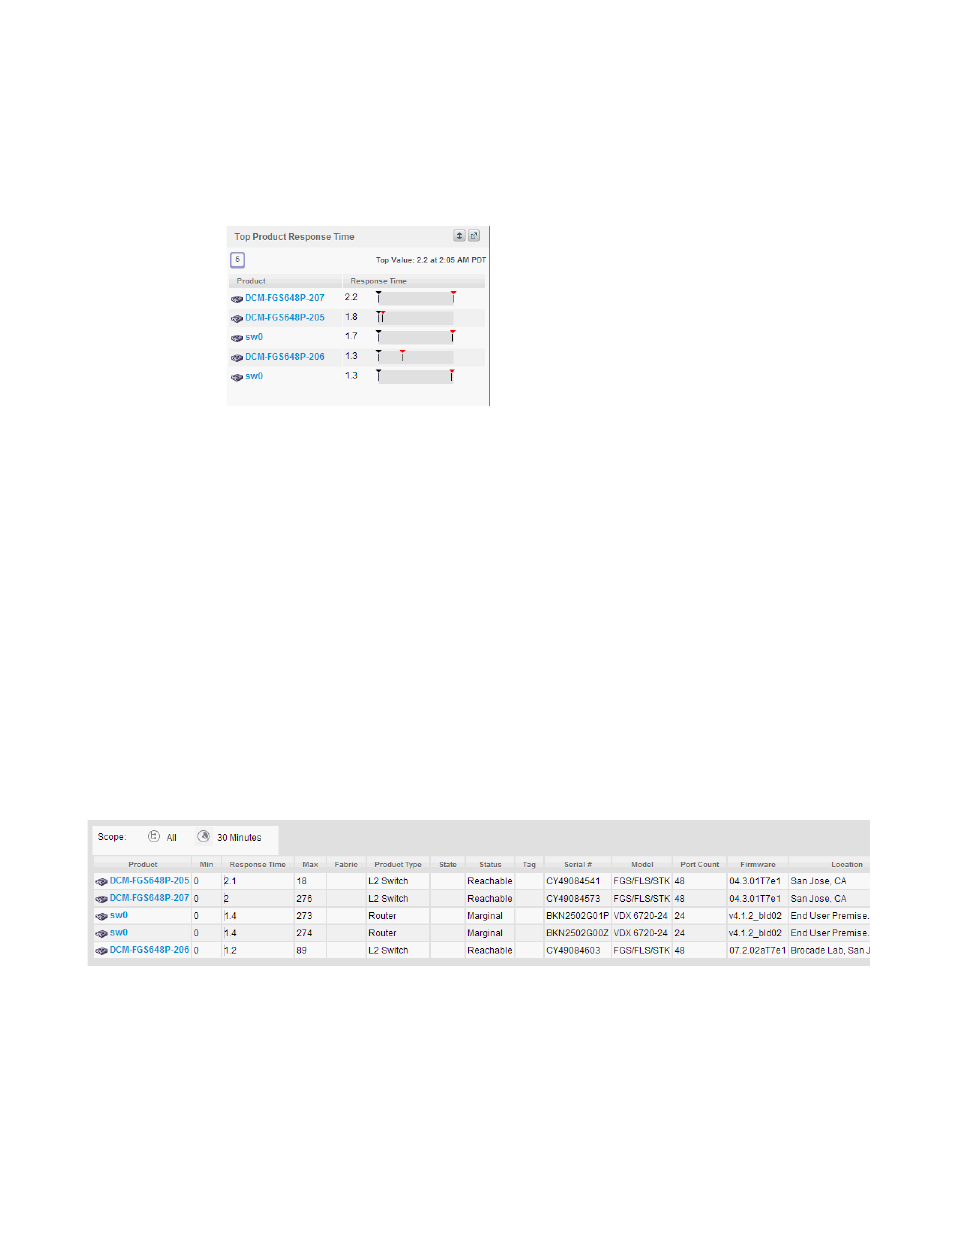
Top Product Response Time monitor
The Top Product Response Time monitor (
Figure 116
) displays the top product response time in a
table.
FIGURE 116
Top Product Response Time monitor
The Top Product Response Time monitor includes the following data:
•
Widget title — The name of the widget.
•
View Details icon — Click to launch the Detailed View page.
•
Widget summary — The product count for each status (worst to best) displays underneath the
widget title.
•
Top value — The highest value in the table.
•
Product — The product affected by this monitor. Click to launch the Product page for this device
(refer to
on page 316). When you launch the Product page, the
detailed view closes.
•
Response Time (ms) — The top response time in milliseconds. Pause on a rown to display the
minimum, current, and maximum vaules for the selected row. This field also displays minimum
(black) and maximum (red) pointers.
•
Fabric — The fabric to which the device belongs.
Viewing additional details for the Top Product Response Time monitor
1. Click the View Details icon.
FIGURE 117
Top Product Response Time Detailed View
A more detailed widget displays which includes the following data:
•
Scope — The scope configured for the dashboard.