Top or bottom product performance monitors – Brocade Network Advisor SAN + IP User Manual v12.3.0 User Manual
Page 508
436
Brocade Network Advisor SAN + IP User Manual
53-1003155-01
User-defined performance monitors
8
Top or bottom product performance monitors
The top or bottom product performance monitors (
) display the top or bottom number of
products (for example, top 10 products) for the selected measure in a table.
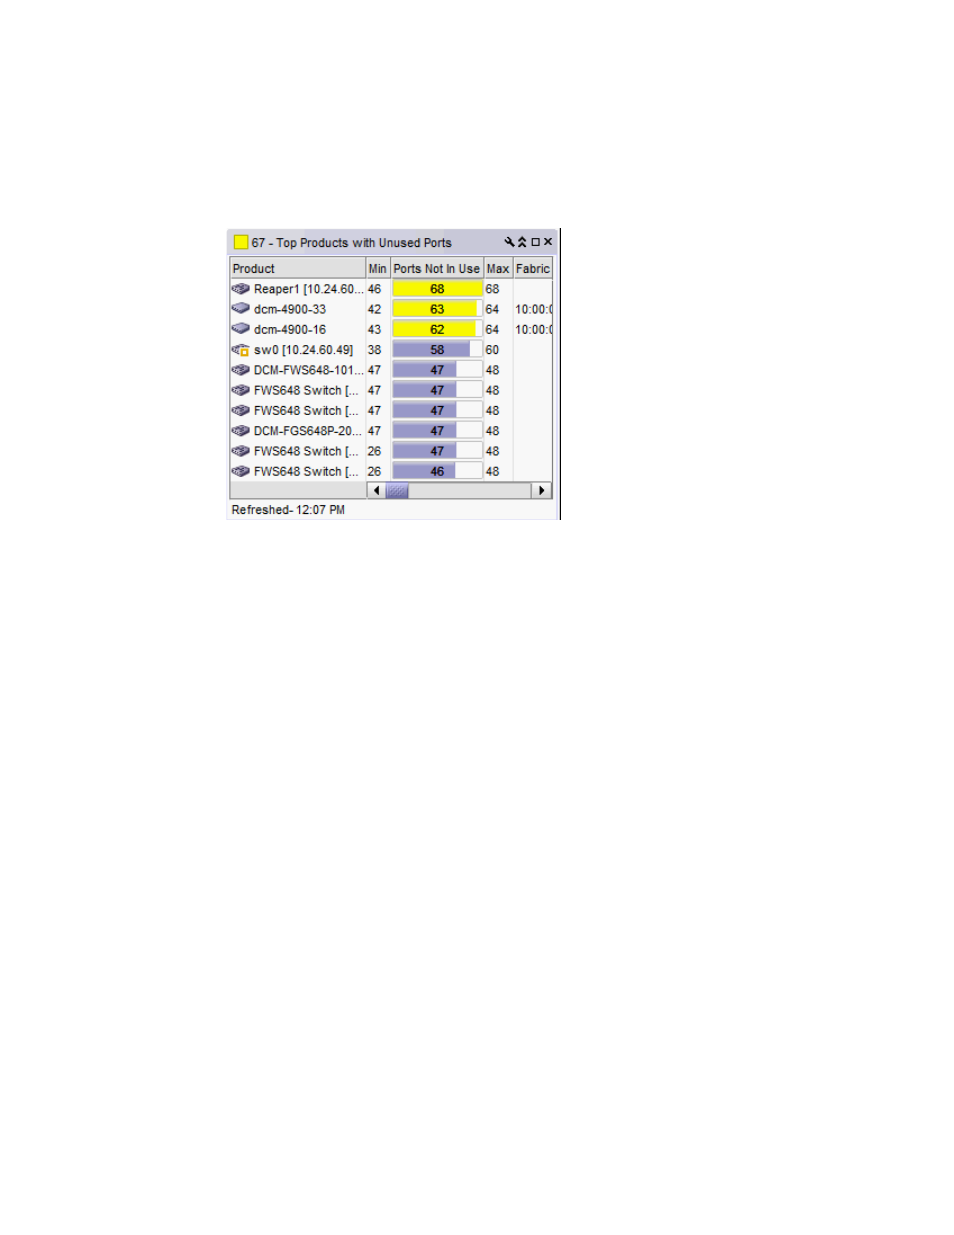
FIGURE 192
Top or bottom product performance monitor example
The top or bottom product performance monitor includes the following data:
•
Threshold icon/object count/monitor title — The color associated with the threshold and
number of objects within that threshold displays next to the monitor title.
•
Product — The product affected by this monitor.
•
Min — The minimum value of the measure in the specified time range.
•
Measure_Type — The percentage bar of the selected measure.
By default, products display sorted by the Measure_Type value (Top products sort from highest
to lowest and bottom products sort lowest to highest). Click a column head to sort the columns
by that value.
•
Max — The maximum value of the measure in the specified time range.
•
Fabric — The fabric to which the device belongs.
•
Product Type — The type of product (for example, switch).
•
State — The product state (for example, Offline).
•
Status — The product status (for example, Reachable).
•
Tag — The product tag.
•
Serial # — The serial number of the product.
•
Model — The product model.
•
Port Count — The number of ports on the product.
•
Firmware — The firmware level running on the product.
•
Location — The location of the product.
•
Contact — A contact name for the product.
•
Refreshed — The time of the last update for the monitor.