Status widget – Brocade Network Advisor SAN + IP User Manual v12.3.0 User Manual
Page 348

276
Brocade Network Advisor SAN + IP User Manual
53-1003155-01
Dashboard customization
7
•
Pie chart — The device status as a percentage of the total number of devices.
The pie chart displays the percentage in various colors on each slice. Tooltips showing the
number of devices in that state are shown when you pause on the slice. When there is one
status category with less than one percent of the total number of devices, the status widget
displays the number of devices in each category on each slice. Double-click a section in the
graph to navigate to the SAN Inventory Detailed View page. For more information, refer to
“Viewing additional SAN product data”
on page 274.
Color legend — Displays the color legend below the pie chart. Click the Show Legend icon to
display.
-
Green — Healthy
-
Yellow — Marginal
-
Red — Down
-
Blue — Not Reachable
-
Gray — Unknown
Status widget
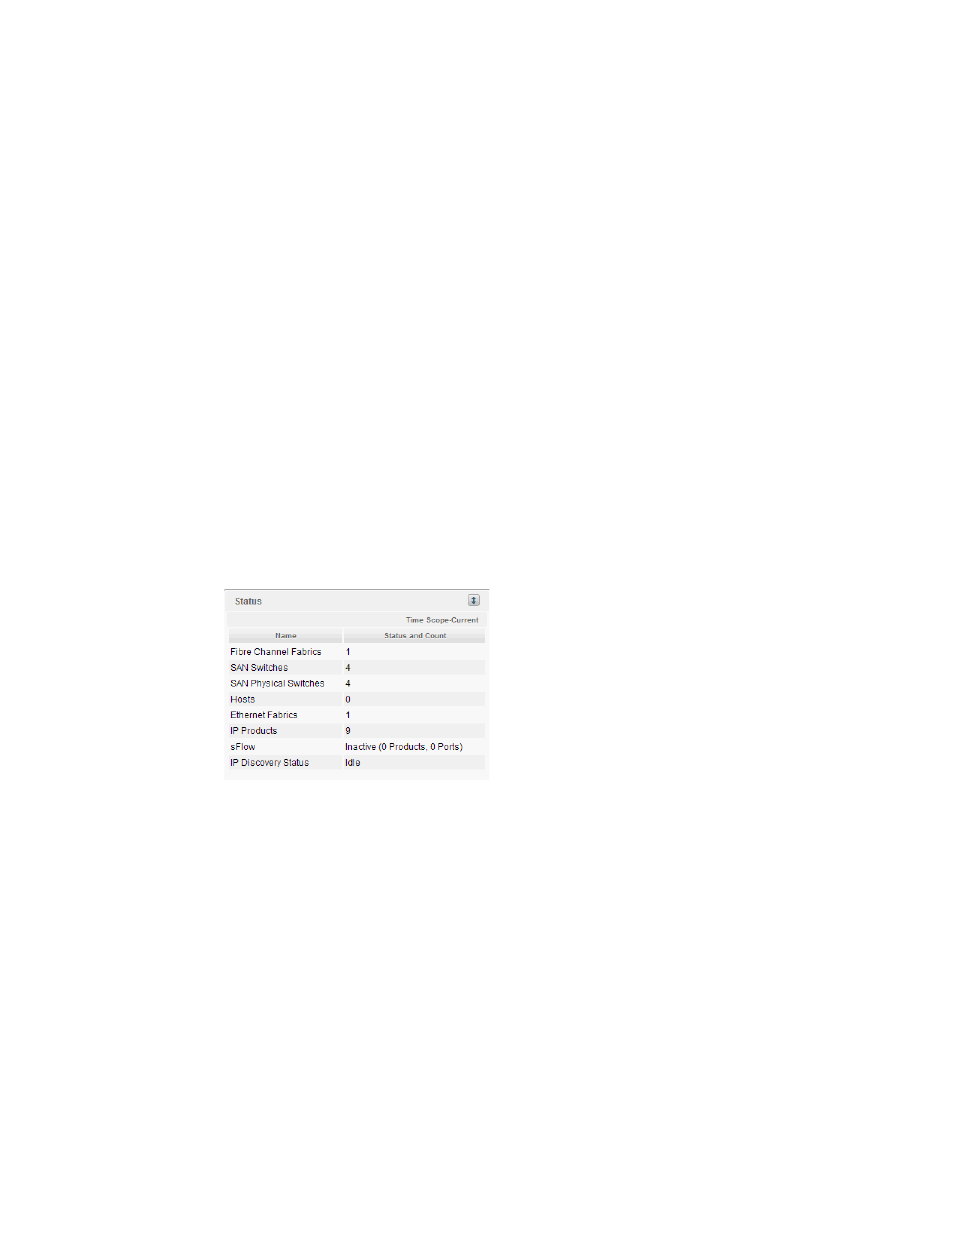
The Status widget (
Figure 105
) displays the number of products managed and the number of
events within the selected event time range, as well as various IP management processes and their
current state.
FIGURE 105
Status widget
The Status widget displays the following items for each product license:
•
Time Scope — The time scope.
•
Fibre Channel Fabrics — The number of managed fabrics.
•
SAN Switches — The number of managed SAN switches.
•
SAN Physical Switches — The number of discovered physical SAN switches.
•
Hosts — The number of managed hosts.
•
Ethernet Fabrics — The number of managed Ethernet fabrics.
•
IP Products — The number of managed IP products.
•
sFlow — The current sFlow state.
•
IP Discovery Status — The current IP discovery status.
