Brocade Network Advisor SAN + IP User Manual v12.3.0 User Manual
Page 376
304
Brocade Network Advisor SAN + IP User Manual
53-1003155-01
Dashboard customization
7
•
Memory Utilization Percentage — The top memory utilization percentages. Pause on a rown to
display the minimum, current, and maximum vaules for the selected row. This field also
displays minimum (black) and maximum (red) pointers.
Viewing additional details for the Top Product Memory Utilization monitor
1. Click the View Details icon.
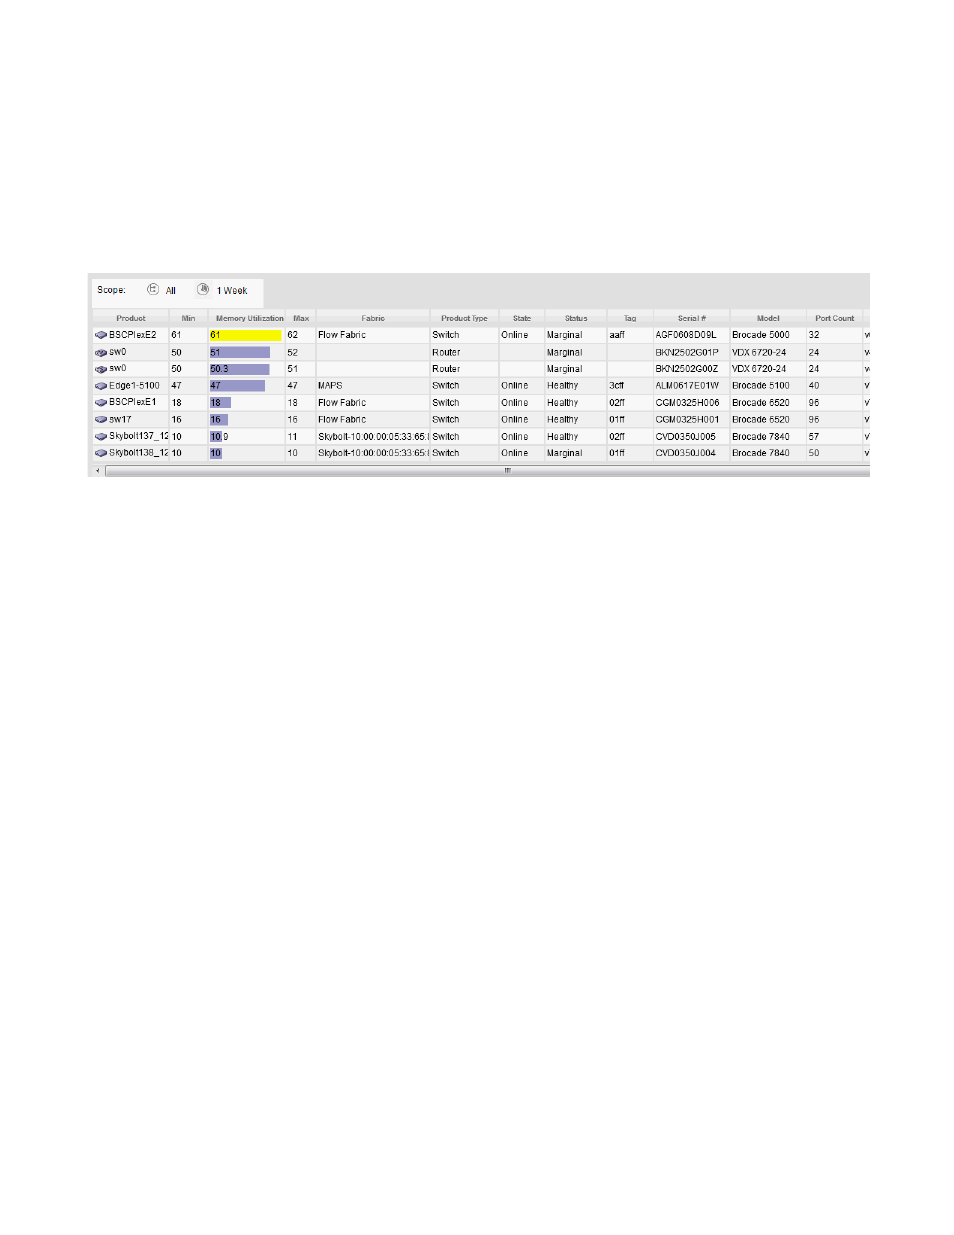
FIGURE 115
Top Product Memory Utilization Detailed View
A more detailed widget displays which includes the following data:
•
Scope — The scope configured for the dashboard.
•
Product — The product affected by this monitor. Click to launch the Product page for this
device (refer to
on page 316). When you launch the Product
page, the detailed view closes.
•
Min — The minimum value of the measure in the specified time range.
•
Memory Utilization Percentage — The top memory utilization percentages.
•
Max — The maximum value of the measure in the specified time range.
•
Fabric — The fabric to which the device belongs.
•
Product Type — The type of product (for example, switch).
•
State — The product state (for example, Offline).
•
Status — The product status (for example, Reachable).
•
Tag — The product tag.
•
Serial # — The serial number of the product.
•
Model — The product model.
•
Port Count — The number of ports on the product.
•
Firmware — The firmware level running on the product.
•
Location — The location of the product.
•
Contact — A contact name for the product.
2. Click the close (X) button.