Events widget – Brocade Network Advisor SAN + IP User Manual v12.3.0 User Manual
Page 458

386
Brocade Network Advisor SAN + IP User Manual
53-1003155-01
Status widgets
8
Events widget
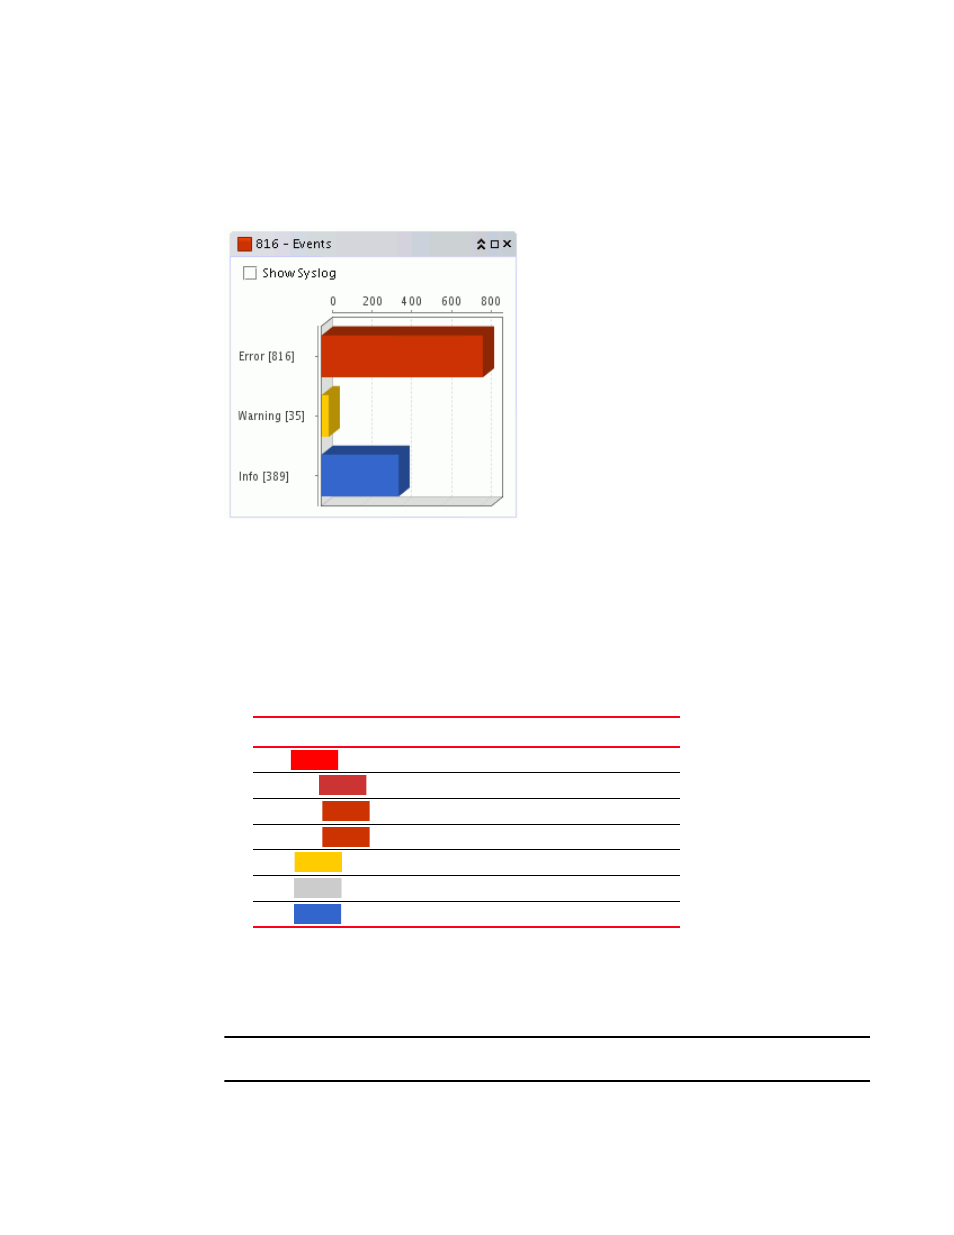
The Events widget (
) displays the number of events by severity level for a specified
network scope, specified time scope, and duration as a stacked bar graph.
FIGURE 165
Events widget
The Events widget includes the following data:
•
Severity icon/widget title/event count — The color of the worst severity followed by the event
count with that severity displays before the widget title.
•
Show Syslog check box — Select to include Syslog information (default) on the Event Summary.
•
Bar chart — The event severity using the color codes in
•
Network Scope — Select to display the events count of the products present in the selected
network scope.
•
Time Scope — Select to display the events count of the products present in the selected time
range and duration.
NOTE
Application events excluding object level are displayed only if All is selected in the Network Scope.
The Events widget only includes events from products that are in your AOR.
TABLE 36
Event severity color codes
Color
Severity
Red
(
)
Emergency
Brick Red
(
)
Alert
Brick Red
(
)
Critical
Brick Red
(
)
Error
Gold
(
)
Warning
Grey
(
)
Notice
Blue
(
)
Info
