Top or bottom port performance monitors – Brocade Network Advisor SAN + IP User Manual v12.1.0 User Manual
Page 403

338
Brocade Network Advisor SAN + IP User Manual
53-1002949-01
User-defined performance monitors
8
Top or bottom port performance monitors
The top or bottom port performance monitors (
) display the top or bottom number of
ports (for example, bottom 10 ports) for the selected measure in a table.
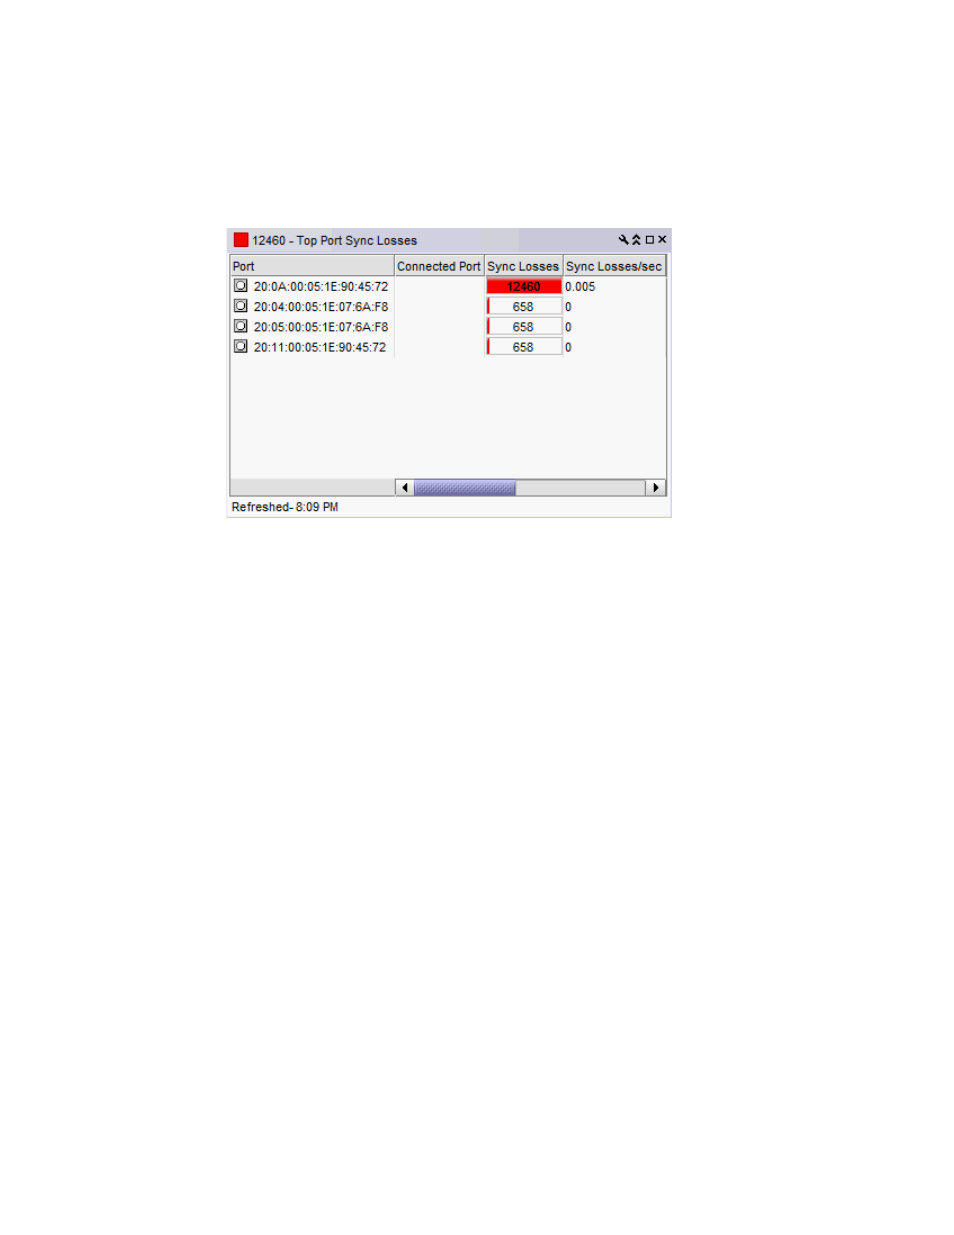
FIGURE 131
Top or bottom port performance monitor example
The top or bottom port performance monitor includes the following data:
•
Threshold icon/object count/monitor title — The color associated with the threshold and
number of objects within that threshold displays next to the monitor title.
•
Severity icon/monitor title — The worst severity of the data based on the error count or error
rate shown next to the monitor title.
•
Port — The port affected by this monitor.
•
Connected_Port_Link (where Connected_Port_Link is Connected Port, Initiator, or Target) —
Displays one of the following:
-
Connected Port — The ISL or IFL port on the connected device. Click to launch the switch
port properties dialog box.
-
Initiator — The initiator port on the connected device. Click to launch the device properties
dialog box.
-
Target — The target port on the connected device. Click to launch the device properties
dialog box.
•
Measure_Type — The percentage bar of the selected measure. Depending on the selected
measure, both the error rate (per second) and error count may display. For selected measures,
more than one Measure_Type may display (for example RX and TX).
By default, ports display sorted by the Measure_Type value (Top ports sort from highest to
lowest and bottom ports sort lowest to highest). Click a column head to sort the columns by
that value.
•
Product — The product affected by this monitor.
•
Type — The type of port (for example, U-Port).
•
Identifier — The port identifier.
•
Port Number — The port number.
