San fabric monitoring – Brocade Network Advisor SAN + IP User Manual v12.1.0 User Manual
Page 129

62
Brocade Network Advisor SAN + IP User Manual
53-1002949-01
SAN Fabric monitoring
4
SAN Fabric monitoring
NOTE
Monitoring is not supported on Hosts. The upper limit to the number of HBA and CNA ports that can
be monitored at the same time is 32. The same upper limit applies if switch ports and HBA ports are
combined. You can select switch ports and adapter ports from a maximum of ten devices.
Fabric monitoring enables discovery of and data collection for the specified fabric and all
associated devices. The Management application enables you to view fabric monitoring status
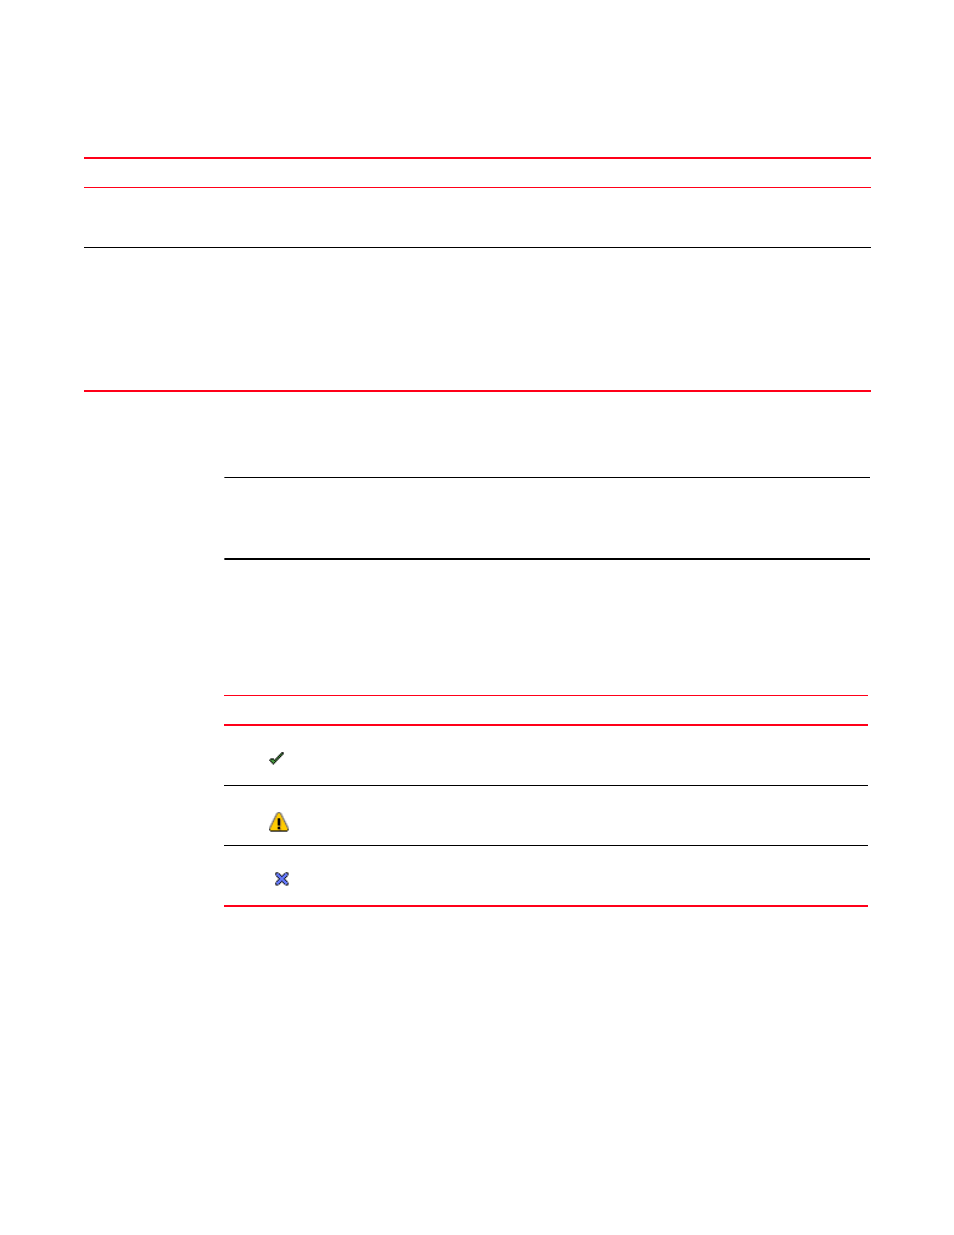
through the Discover Fabrics dialog box. The following table illustrates and describes the icons that
indicate the current status of the discovered switches.
For Professional and Professional Plus, the default monitoring interval is 120 seconds (minimum
interval is 120 seconds).
details the default and minimum monitoring intervals used to query the monitored
switches:
At the time of discovery or fabric refresh, the SNMP v3 user account does not have a matching
Fabric OS switch user account.
This is required to obtain performance statistics from all logical switches.
Make sure the SNMP v3 user account
is also defined as a Fabric OS switch
user.
At the time of fabric refresh, the physical chassis is reachable; however, a previously discovered
logical switch is not reachable.
The logical switch has been deleted
or the Fabric ID was changed.
To find a logical switch, right-click the
physical chassis within the Chassis
Group in the Product List and select
Logical Switches.
All logical switches on the selected
physical chassis display in a list.
Problem
Resolution
TABLE 21
Monitor Icons
Icon
Description
Displays when the switch is managed and the switch management status is okay.
Displays when the switch is managed and the switch management status is not okay.
Displays when the fabric or switch is not managed or not monitored.
