Brocade Network Advisor SAN + IP User Manual v12.1.0 User Manual
Page 1648

1602
Brocade Network Advisor SAN + IP User Manual
53-1002949-01
Monitoring Flows
44
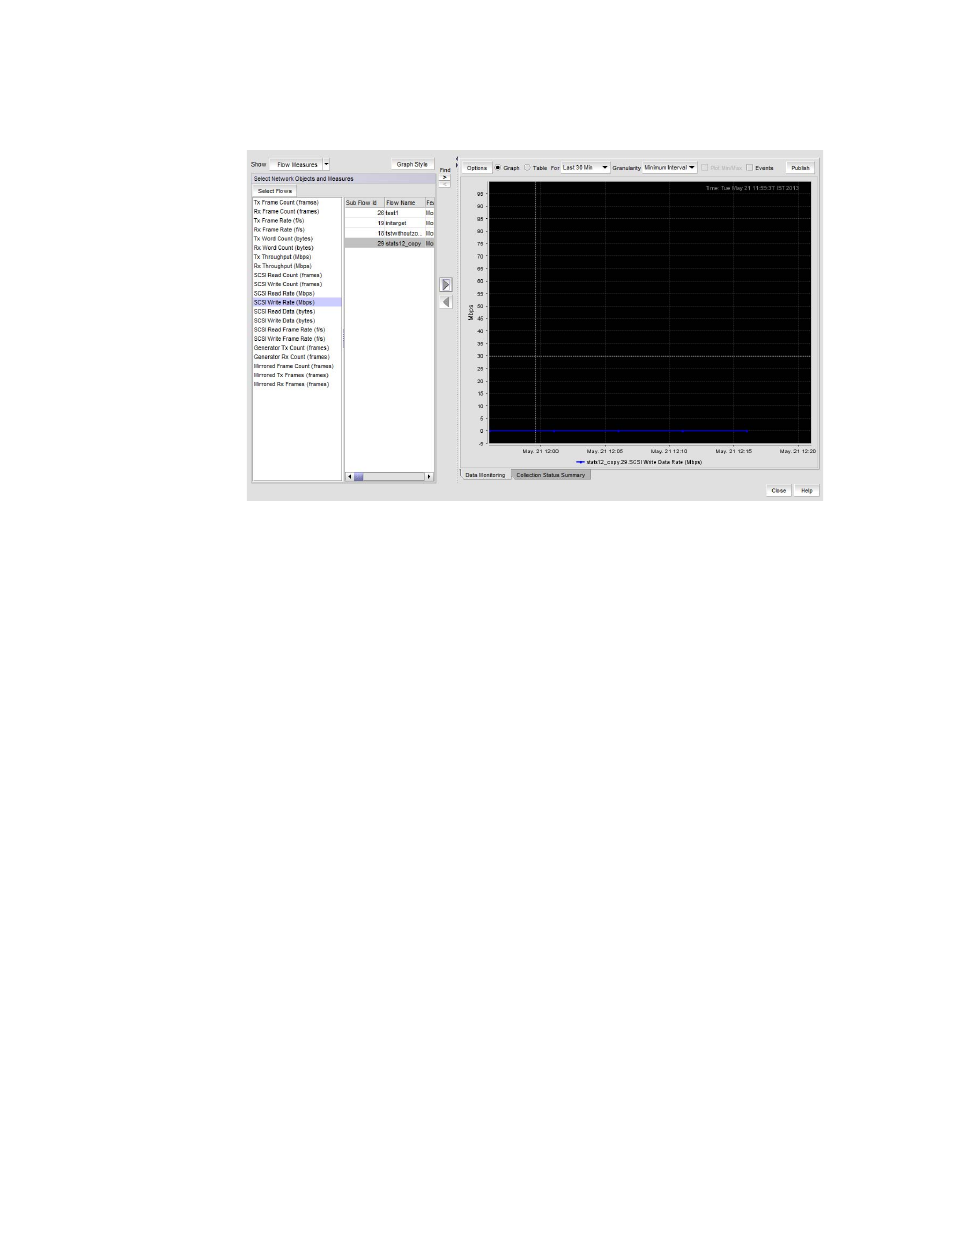
FIGURE 702
Historical Graph (Flow Measures selected)
Control functions on the Historical Graphs/Tables dialog box, such as plotting new sub-flows
and creating a flow performance monitor on the dashboard, as follows:
-
Plot different sub-flows and measures in the graph area by selecting them in the columns
under Select Network Objects and Measures and moving them to the graph with the right
arrow. Move sub-flows and measures out of the graph by selecting them on the graph, and
then selecting the left arrow.
-
To launch the Flow Vision dialog box for sub-flows, select Select Flows.
-
To create a flow performance monitor on the dashboard, select a flow and one or more
measures from the Select Network Objects and Measures columns, and then select
Publish on the tool bar at the top of the dialog box.
-
To toggle columns on the left side of the dialog box between flow and measure display,
select Flows or Flow Measures from the Show menu. Refer to
on page 1603 for more information.
-
To use other general control functions on the tool bar at the top of this dialog box, refer to
for
