Brocade Network Advisor SAN + IP User Manual v12.1.0 User Manual
Page 1680
1636
Brocade Network Advisor SAN + IP User Manual
53-1002949-01
Data monitoring
46
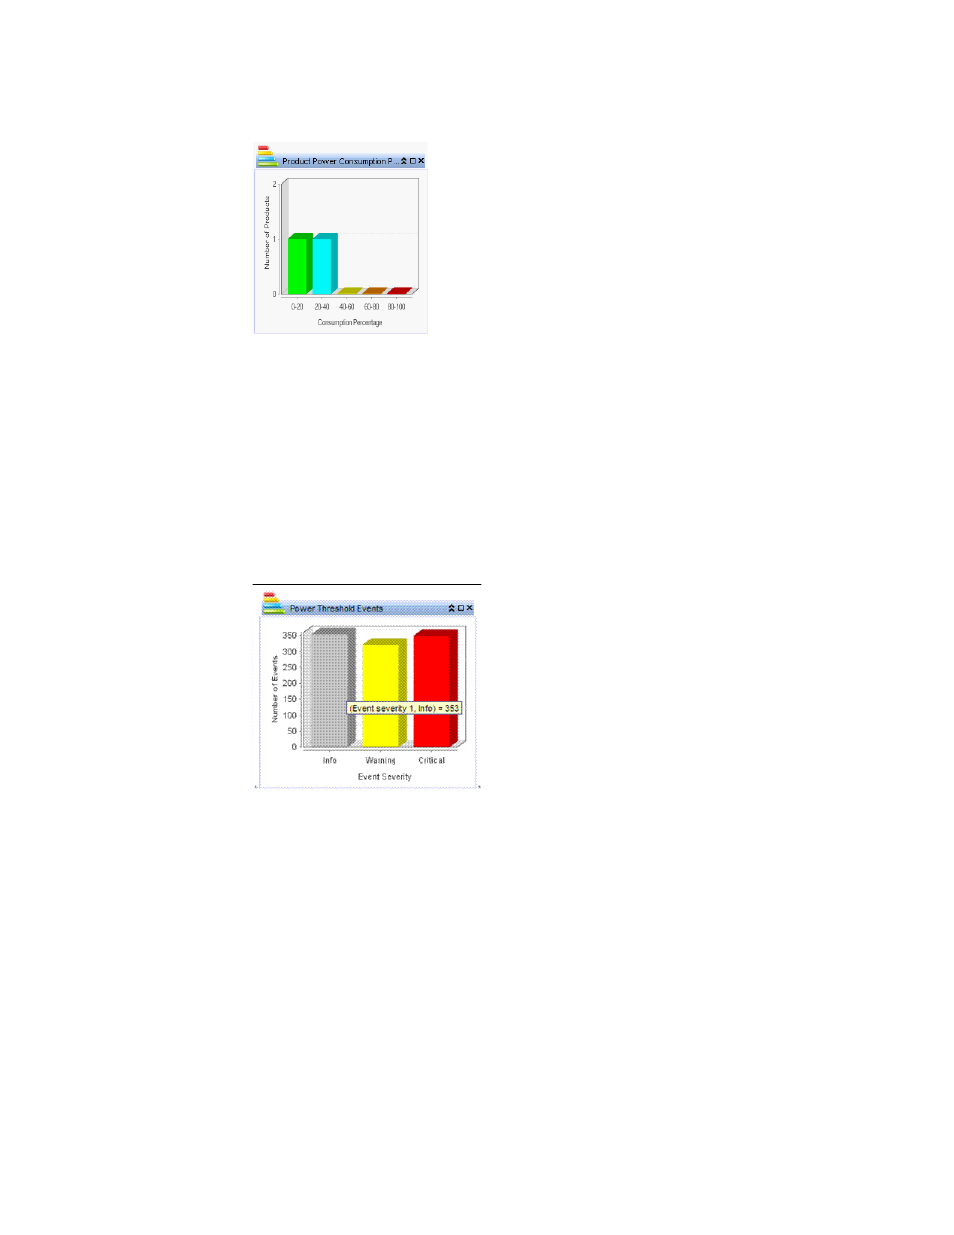
FIGURE 710
Product Power Consumption Percentage bar graph
Displays the power consumption percentages for all products in a bar graph using the following
colors:
•
0 – 20 % = Green
•
20 – 40 % = Blue
•
40 – 60 % = Yellow
•
60 – 80 % = Orange
•
80 – 100 % = Red
Click a bar in the chart to display the products panel and highlight the corresponding products.
FIGURE 711
Power Threshold Events bar graph
Displays the number of threshold events triggered by severity in a bar graph using the following
colors:
•
Critical = Red
•
Warning = Yellow
•
Info = Grey