Monitoring flows, Monitoring flows 3 – Brocade Network Advisor SAN + IP User Manual v12.1.0 User Manual
Page 1639

Brocade Network Advisor SAN + IP User Manual
1593
53-1002949-01
Monitoring Flows
44
Monitoring Flows
After you define flows for a fabric you can monitor them using the flow Flow Vision dialog box. The
dialog box supports all the flows defined on the switches through the management application or
CLI commands. Data display for flows includes all measures supported by the flow monitoring
features and AMS violations on monitored flows. You can adjust the dialog box to display data for
multiple flows, time durations, hide and display SCSI and frame-related measures, launch graphs
of flow data, and change fabrics where flows are monitored, You can also select features (Flow
Monitor, Mirror, and Generator) to display measures for sub-flows where the feature is active.
To monitor flows in the Flow Vision dialog box, use the following steps:
1. Launch the Flow Vision dialog box, use one of the following options:
-
Select Monitor >
Fabric
Vision > Flow > Monitor from the SAN tab menu bar.
-
Right-click one of the following objects from the Connectivity Map or Product List, and then
select Flow Vision > Flow > Monitor from the displayed menu. Note that a port need not be
in an active flow definition to launch the dialog box.
•
Switch port
•
Initiator port
•
Target port
•
Switch that supports Flow Vision
•
Fabric with one or more switches that support Flow Vision
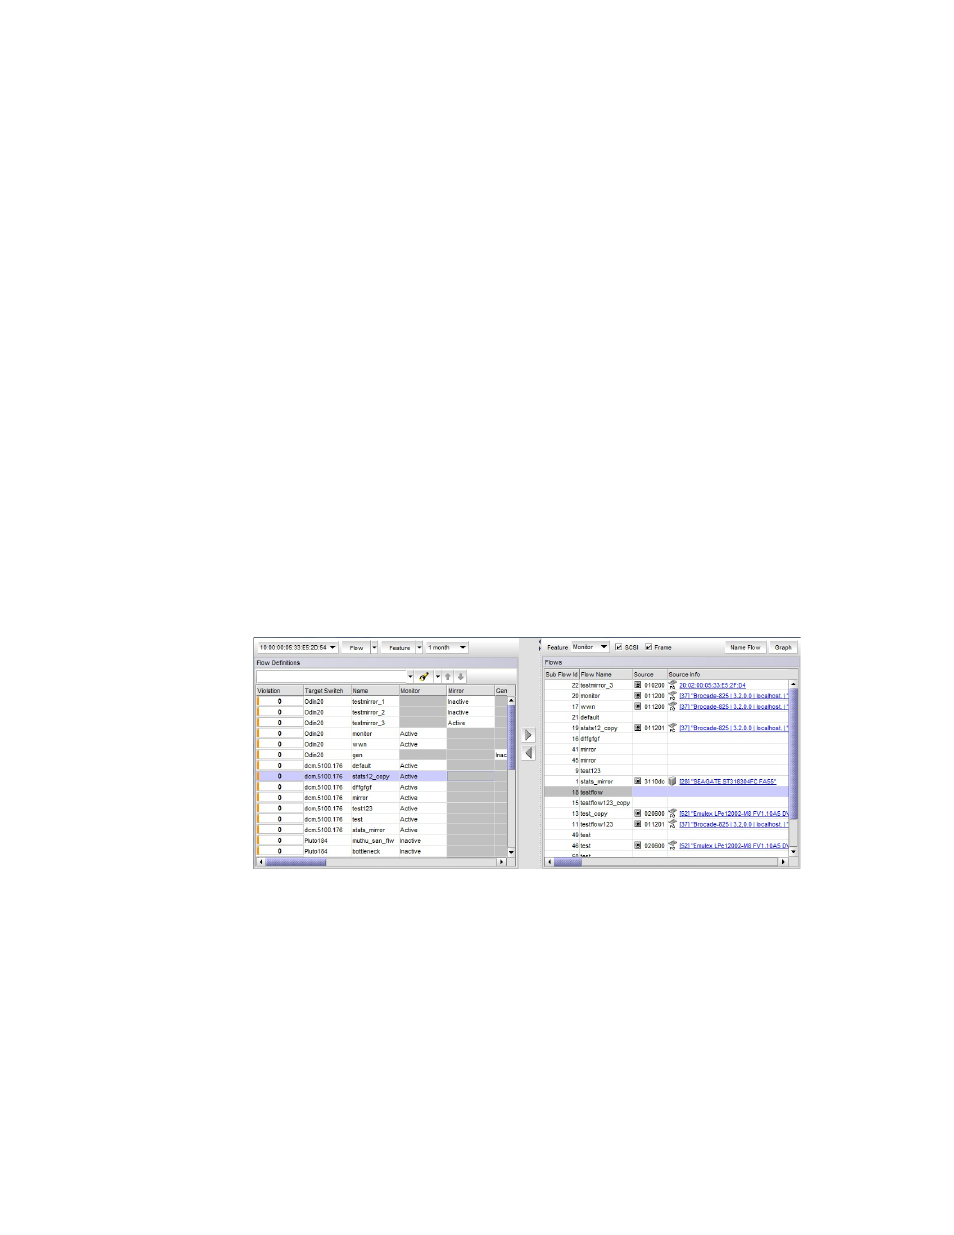
The Flow Vision dialog box displays (
[
FIGURE 699
Flow Vision dialog box
The Flow Definitions panel displays all current flow definitions for the fabric displayed in the
fabric list above the panel. The number of AMS violations detected during the set time duration
also display for each flow under the Violation column. The Flows panel displays statistics and
flow data for active and inactive flows being monitored.
