Figure 667 – Brocade Network Advisor SAN + IP User Manual v12.1.0 User Manual
Page 1579

1532
Brocade Network Advisor SAN + IP User Manual
53-1002949-01
IP historical performance monitoring
43
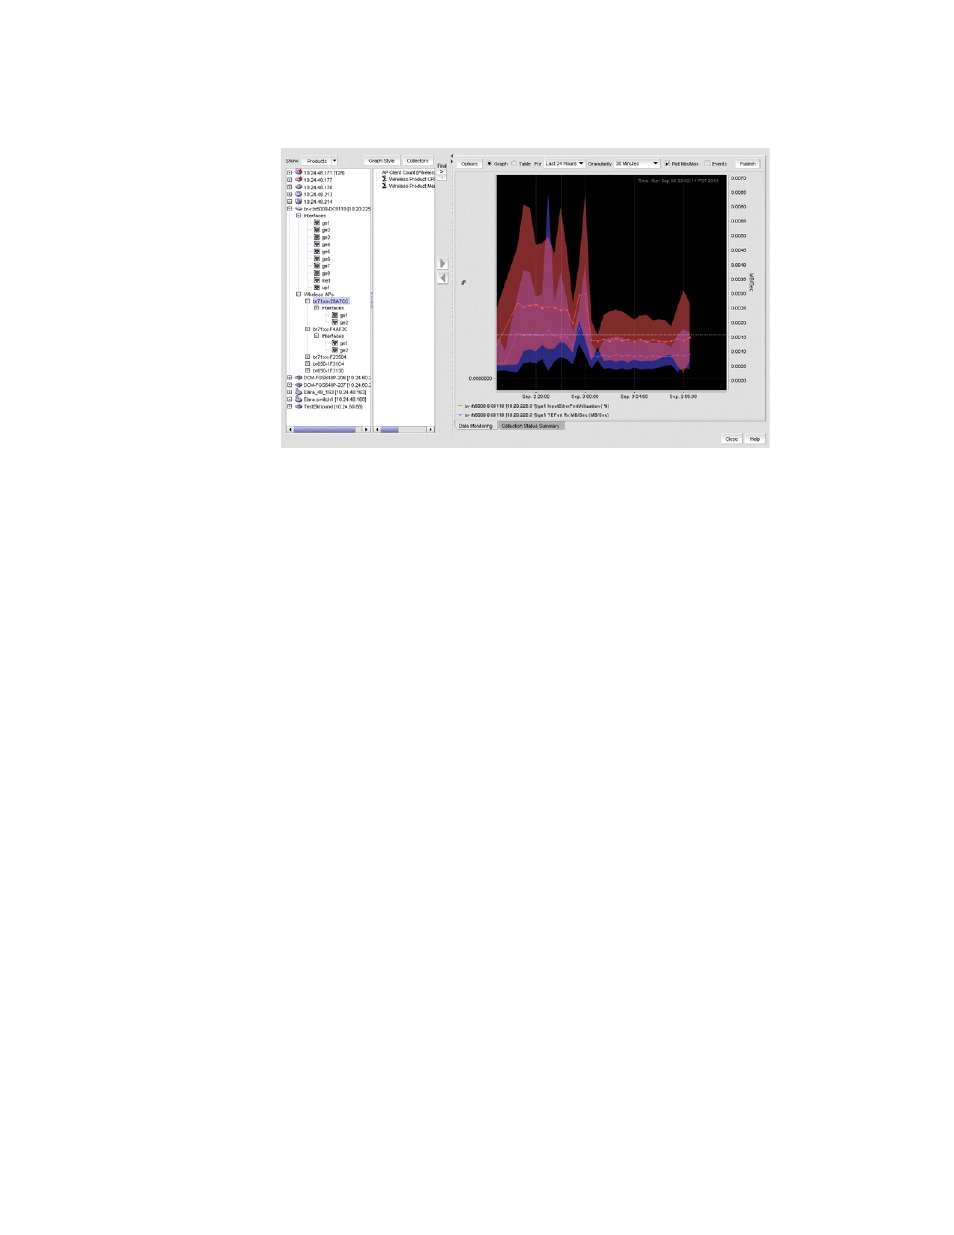
FIGURE 667
Wireless controller and APs display
•
Select Collectibles and the left panel displays measures (MIB objects and expressions)
currently being collected. Select a measure, and the targets (products or ports) from which
the measure was collected display in the right panel. If SAN historical data collection is
enabled, corresponding SAN products and ports display.
Measures also display for SAN products, ports, and FCIP tunnels that appear in the device
tree. In addition, measures collected for attached wireless access point (AP) and devices
and controllers display. You can select these collectibles to create applicable historical
graphs and tables.
4. Select Collectors to open the Historical Data Collectors dialog box. Use this dialog box to
display, enable or disable, add or delete, and duplicate historical data collectors. Refer to the
following sections for instructions:
-
“Displaying historical data collectors”
-
“Enabling a historical data collector”
-
“Adding or editing a historical data collector”
5. To configure the look and feel of the performance graph from the Historical Graphs/Tables
dialog box, refer to
“Configuring the performance graph”
6. Once data collection begins, the data is presented on the chart (if Graph is selected) or table (if
Table is selected).
If a graph is displayed, the legend under the graph shows what data each color represents.
Also, you see the following text:
•
MIB: Shows the name of the MIB object that is being used to collect the data and the
device that is being polled. If the target is a port, then the interface ID is also displayed.
•
EXP: Shows the name of the expression being used to collect the data and the device that
is being polled. If the target is a port, then the interface ID is also displayed.
Each collectible is represented by a different color and the color for a collectible can change as
new data is collected.
