Search, Table capabilities, Performance data – Brocade Network Advisor SAN + IP User Manual v12.1.0 User Manual
Page 1268: Real-time performance monitoring
Brocade Network Advisor SAN + IP User Manual
1217
53-1002949-01
Element Manager interface overview
31
Search
NOTE
The Search function retains your last 10 search criteria.
on page 392 for more information.
Table capabilities
“Customizing application tables”
on page 387 for information on table functions.
Performance data
You can use the following options to monitor the performance data of a switch.
•
Real Time Graph/Table
•
Historical Graph/Table
Real-time performance monitoring
Real-time performance monitoring allows you to view a snapshot of the current performance data.
To monitor the real-time performance of the switch, complete the following steps.
NOTE
You can monitor real-time graphs for a slot, multiple slots, a trunk, multiple trunks, a port, or multiple
ports.
1. In the Element Manager, right-click a slot (or slots), trunk (or trunks), or port (or ports) and
select Performance > Real Time Graph/Table.
Or
Select a slot (or slots), trunk (or trunks), or port (or ports), and select Real Time Graph/Table
from the Performance button on the Element Manager toolbar, as shown in
Figure 520
.
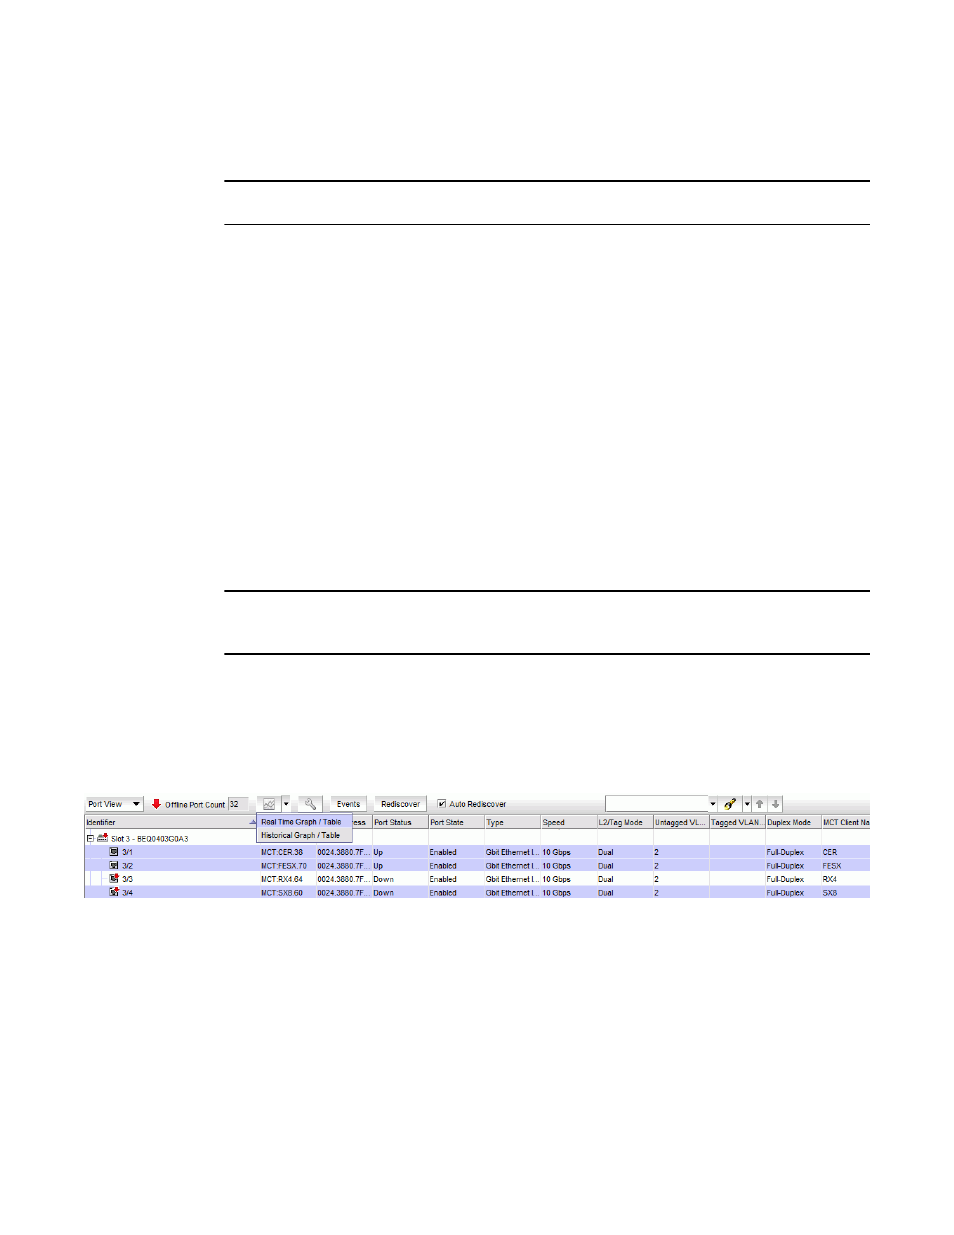
FIGURE 520
Real Time Graph/Table performance data
The performance data for the selected slots, trunks, or ports is displayed in the Real Time
Graphs/Tables window. Refer to
“IP real-time performance monitoring”
on page 1505 for more
information.