Brocade Network Advisor SAN + IP User Manual v12.1.0 User Manual
Page 1580

Brocade Network Advisor SAN + IP User Manual
1533
53-1002949-01
IP historical performance monitoring
43
If a table is displayed, the first column displays the time of the collection. The remaining
columns display the value of each collectible at the specified time. There is one column for
every collectible you select to display.
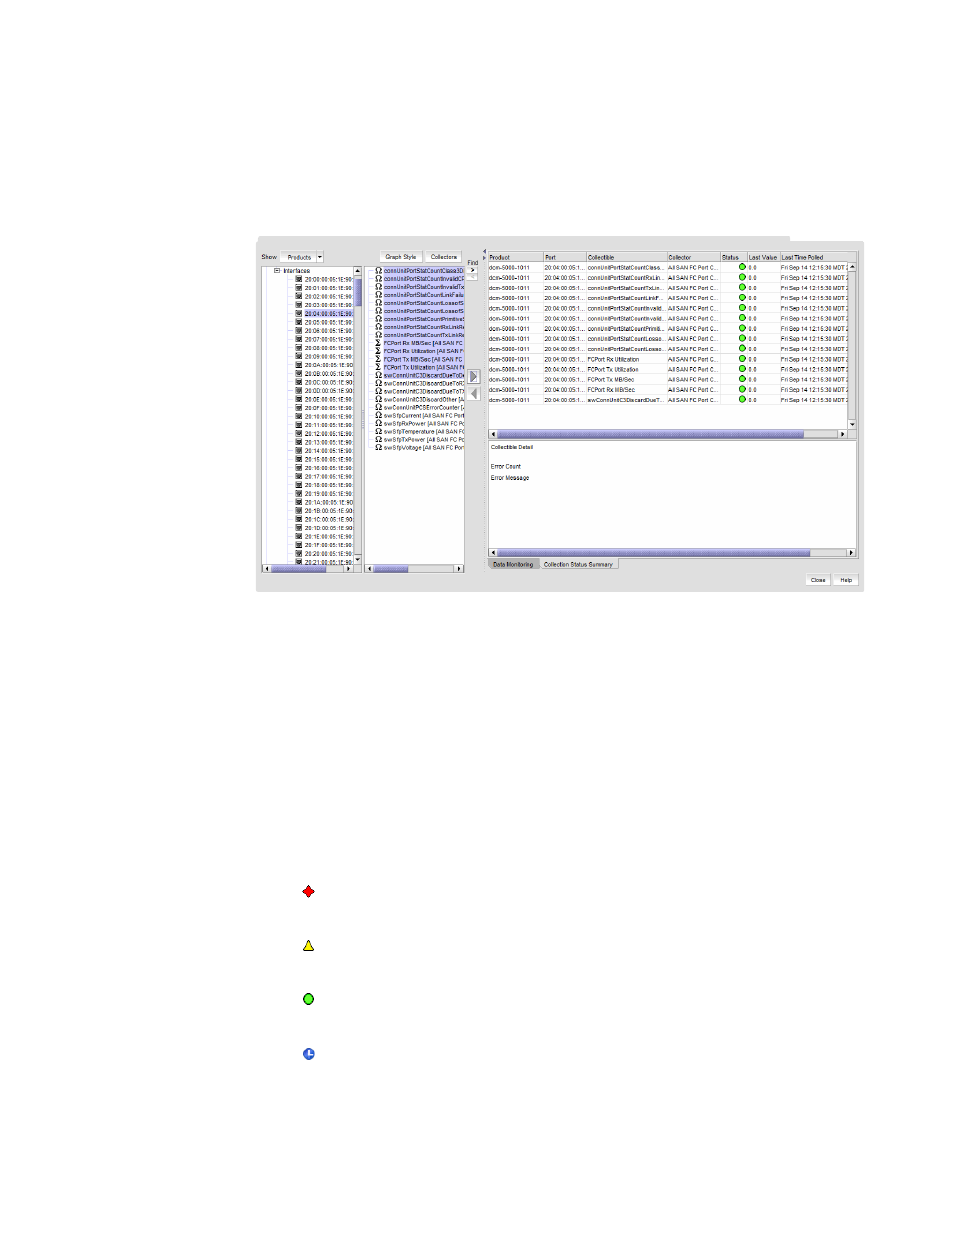
7. Select the Collection Status Summary tab.
FIGURE 668
Historical Graphs/Tables Collection Status Summary tab
The Collection Status Summary tab provides a high level overview of all defined collectors. The
information is displayed in the following columns:
•
Product - Shows the product name. There maybe multiple instances of the product name for
each collectible assigned to the product.
•
Port - The port name when a port is selected.
•
Collectible - The MIB objects and expressions used by the data collector. When you select a
collectible row, collectible information displays in the bottom portion of the panel, such as
errors, error count, and messages.
•
Collector - The data collector name.
•
Status - The status field uses the following icons.
•
Last Value - The last (most current) value collected.
Failed. No value was ever collected for this collectible.
Warning: Data collection failed in the last polling cycle.
Successful: Last collection successful.
Scheduled but not currently active.
