Generating a real-time performance graph, Generating a real-time performance graph 7 – Brocade Network Advisor SAN + IP User Manual v12.1.0 User Manual
Page 1514
Brocade Network Advisor SAN + IP User Manual
1467
53-1002949-01
SAN real-time performance data
43
Generating a real-time performance graph
You can monitor a device’s performance through a performance graph that displays transmit and
receive data. The graphs can be sorted by the column headers. You can create multiple real-time
performance graph instances.
NOTE
To make sure that statistics for a switch does not fail, you must configure SNMP credentials for the
switch. For step-by-step instructions, refer to
To generate a real-time performance graph for a device, complete the following steps.
1. Select the fabric, device, or port for which you want to generate a performance graph
2. Select Monitor > Performance > Real-Time Graph.
If you selected a port, the Real Time Performance Graphs dialog box for the selected port
displays. To filter real-time performance data from the Real Time Performance Graphs dialog
box, refer to
“Filtering real-time performance data”
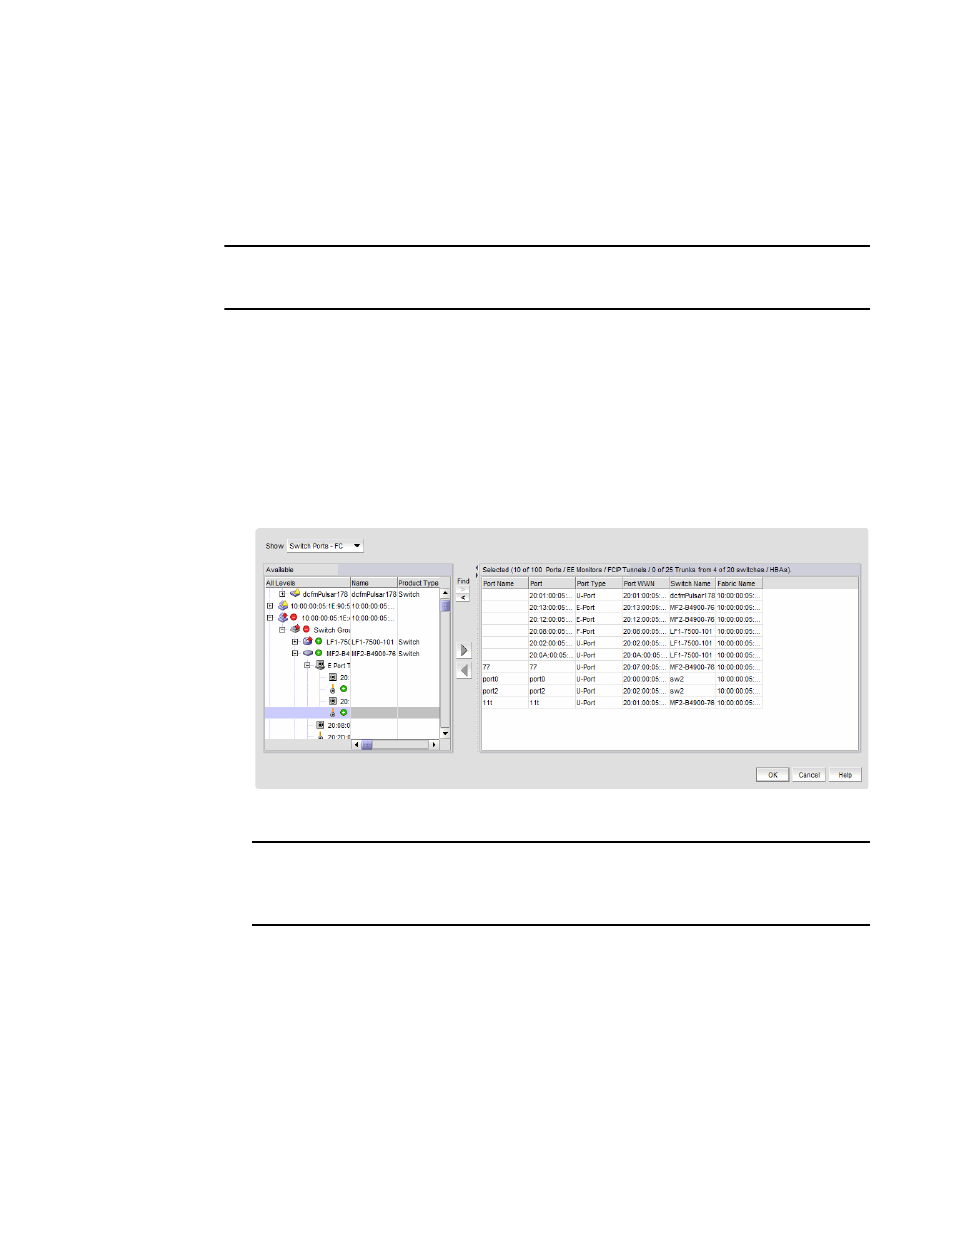
If you selected a fabric or device, the Realtime Port Selector dialog box displays, as shown in
on page 1467. Continue with
.
FIGURE 633
Realtime Port Selector dialog box
NOTE
You can set columns in right side of the dialog box for FICON display using Server > Options >
SAN DIsplay. The first eight columns will display FC Address, Serial #, Tag, Product Type, Model,
Vendor, Port Name, Port Type, and Port WWN.