Dashboard toolbar – Brocade Network Advisor SAN + IP User Manual v12.1.0 User Manual
Page 336

Brocade Network Advisor SAN + IP User Manual
271
53-1002949-01
Dashboard overview
8
9. Status bar — Displays the connection, port, product, fabric, special event, Call Home, and
backup status, as well as Server and User data. For more information about the status bar,
refer to
Dashboard toolbar
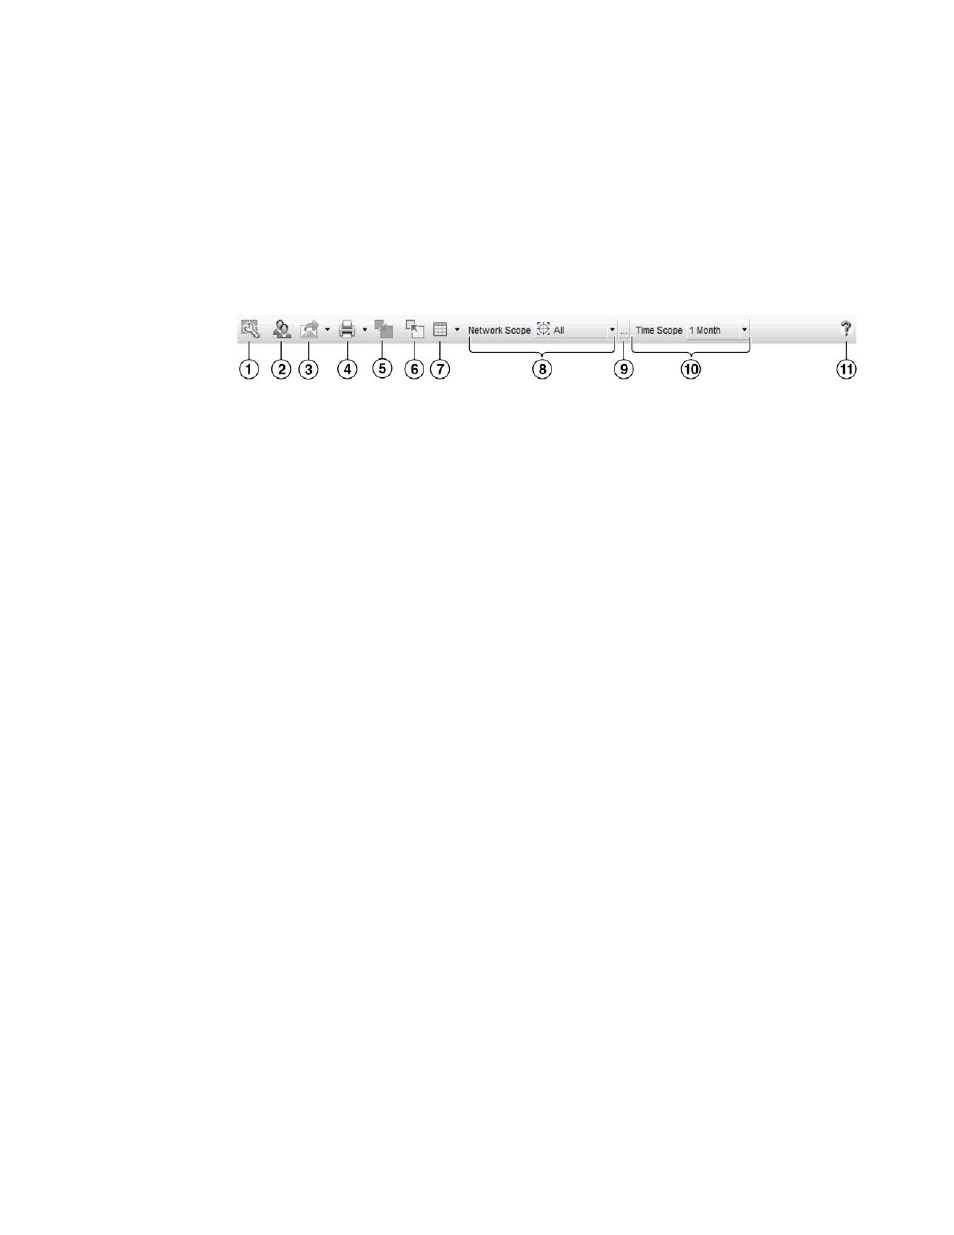
The toolbar (
) is located beneath the menu bar and provides icons and buttons to perform
various functions.
FIGURE 96
Toolbar
The toolbar contains the following icons and buttons:
1. Customize Dashboard — Displays the Customize Dashboard dialog box. Use to configure which
status widgets and performance monitors display on the Dashboard tab and Performance
Dashboard. For more information, refer to
“Customizing the dashboard widgets and monitors”
2. Users — Displays the Users dialog box. Use to configure users, user groups, and permissions.
For more information, refer to
3. Export list — Saves the current dashboard display (all widgets) or a selected widget in a .png
format. For more information, refer to
“Exporting the dashboard display”
4. Print list — Prints the dashboard display (all widgets) or a selected widget. For more
information, refer to
“Printing the dashboard display”
5. Attach — Returns the dashboard to the main window. For more information, refer to
and detaching the Dashboard tab”
6. Detach — Detaches the dashboard to a separate window. For more information, refer to
“Attaching and detaching the Dashboard tab”
7. Dashboard display list — Use to select how to display the status widgets and performance
monitors in the dashboard. For more information, refer to
“Setting the dashboard display”
8. Network Scope — Use to select the network you want to display in the dashboard. For more
information, refer to
9. Network Scope ellipsis button — Displays the Edit Scopes dialog box. Use to configure or delete
product and port scopes. For more information, refer to
“Creating a customized network
10. Time Scope list — Use to select the specific duration for which you want to display data. For
more information, refer to
“Setting the data display time frame”
11. Help — Displays the online help.
