Dashboard flow performance monitor, Dashboard flow performance monitor 3, Dashboard flow – Brocade Network Advisor SAN + IP User Manual v12.1.0 User Manual
Page 1649: Performance monitor
Brocade Network Advisor SAN + IP User Manual
1603
53-1002949-01
Dashboard flow performance monitor
44
Dashboard flow performance monitor
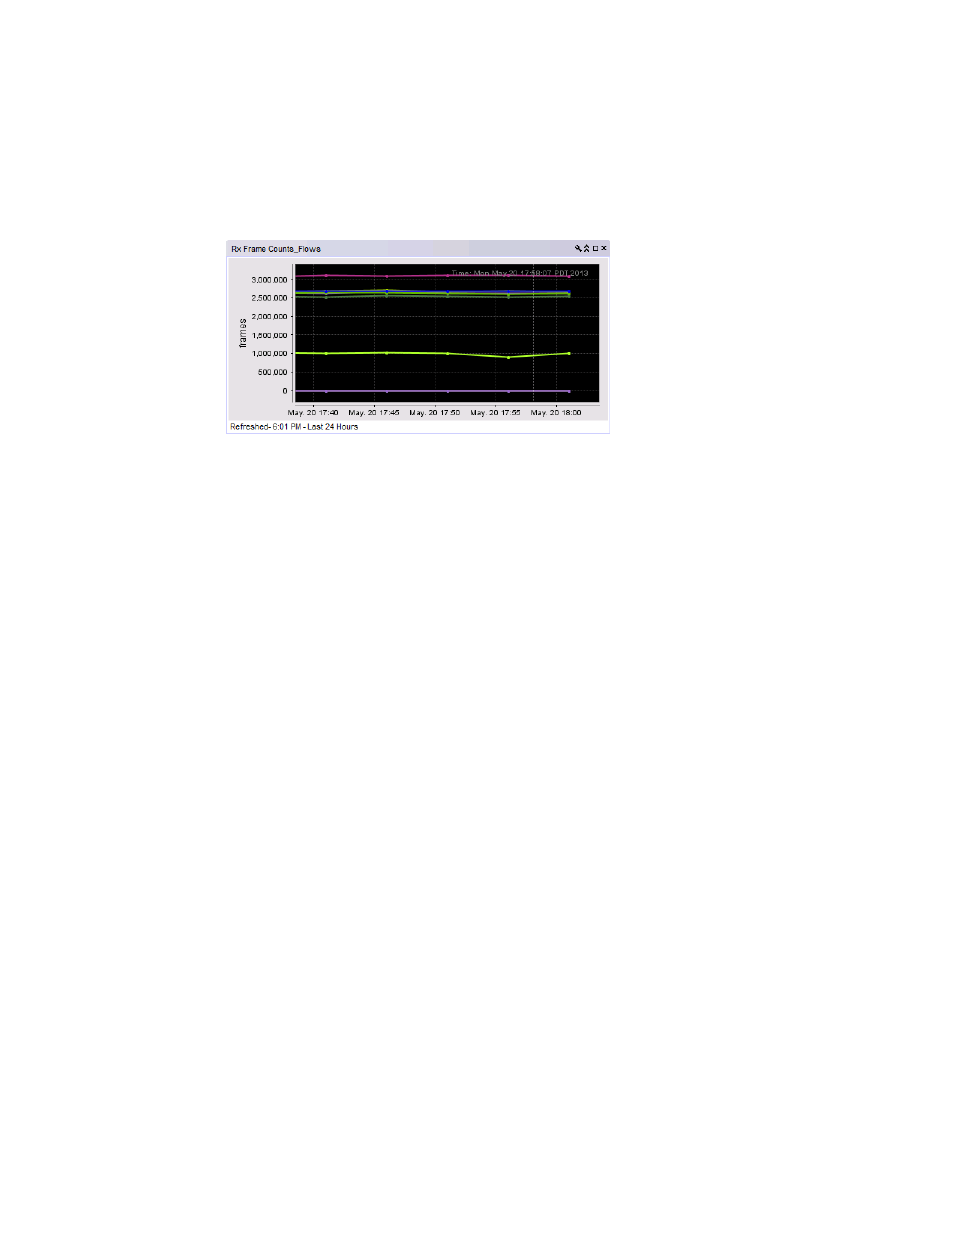
Figure 703
shows a flow performance monitor that you can create using the Publish button on the
Flow Vision performance graph (Historical Graphs/Tables dialog box).
FIGURE 703
Flow performance monitor
Use the dashboard flow performance monitor tool bar and right-click menus to control monitor
display, and launch the Historical Graph/Table and Flow Monitor dialog box for the flow. You can
also modify performance monitors by adding target flows from different fabrics through the Add
Performance Dashboard Monitor dialog box. For more information on configuring and managing
performance monitors, refer to
“Configuring a user-defined traffic flow performance monitor”
To display a performance monitor for flows represented by graphs in the Historical Graphs/Tables
dialog box, perform the following steps:
1. Select flows that you want to graph in the Historical Graphs/Tables dialog box.
2. Select Publish to create a monitor of the graph data for the dashboard.
3. Refer to
“Configuring a monitor from a performance graph”
on page 351 for steps to add the
performance monitor to the dashboard.
“Using Flow Vision dialog box options”
on page 1594 for more information on creating a
performance graph for flows displayed in the Flow Vision dialog box.