Agilent Technologies Signal Analyzer N9030a User Manual
Page 119
3 Programming the Analyzer
Remote Measurement Functions
Option
Description
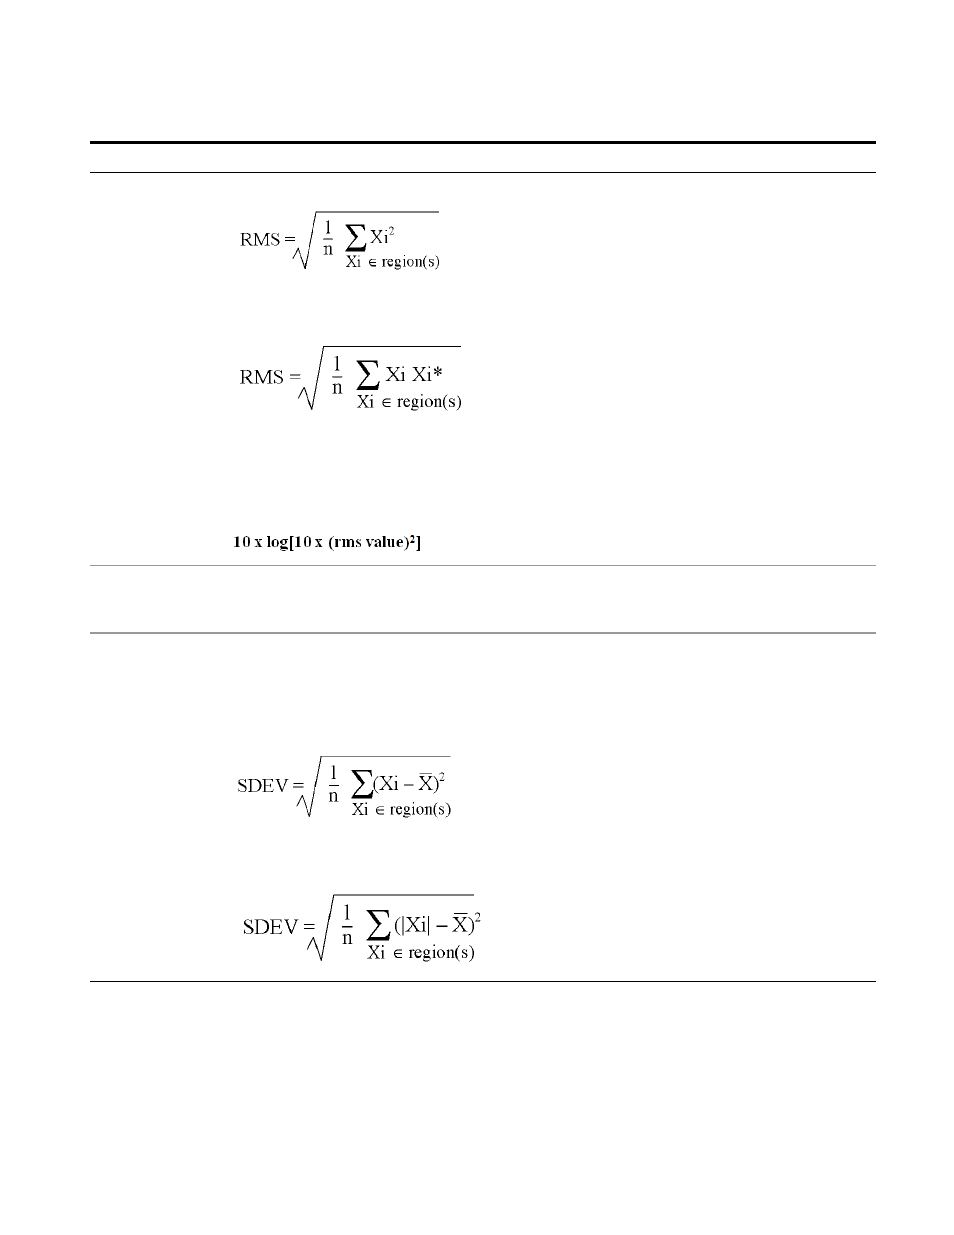
Equation 4: RMS Value of Data Points for Specified Region(s)
where Xi is a data point value, and n is the number of data points in the specified region(s).
Equation 5: RMS Value of I/Q Data Pairs for Specified Region(s)
where Xi is the complex value representation of an I/Q pair, Xi* its conjugate complex number, and n is
the number of I/Q pairs in the specified region(s).
Once you have the rms value for a region of trace data (linear or I/Q), you may want to calculate the
mean power. You must convert this rms value (peak volts) to power in dBm:
SAMPle
(
)
Returns the first data value (x,y pair) for the specified region(s) of trace data. For I/Q trace data, the
first I/Q pair is returned.
SDEViation
(
)
Returns a single value that is the arithmetic standard deviation for the data point values for the
specified region(s) of trace data. See the following equation.
For I/Q trace data, the standard deviation of the magnitudes of the I/Q pairs is returned. See the
following equation.
Equation 6: Standard Deviation of Data Point Values for Specified Region(s)
where Xi is a data point value, X is the arithmetic mean of the data point values for the specified region
(s), and n is the number of data points in the specified region(s).
Remote Language Compatibility Measurement Application Reference
119