Speed and the keyframe graph – Apple Final Cut Pro 7 User Manual
Page 1165
Speed and the Keyframe Graph
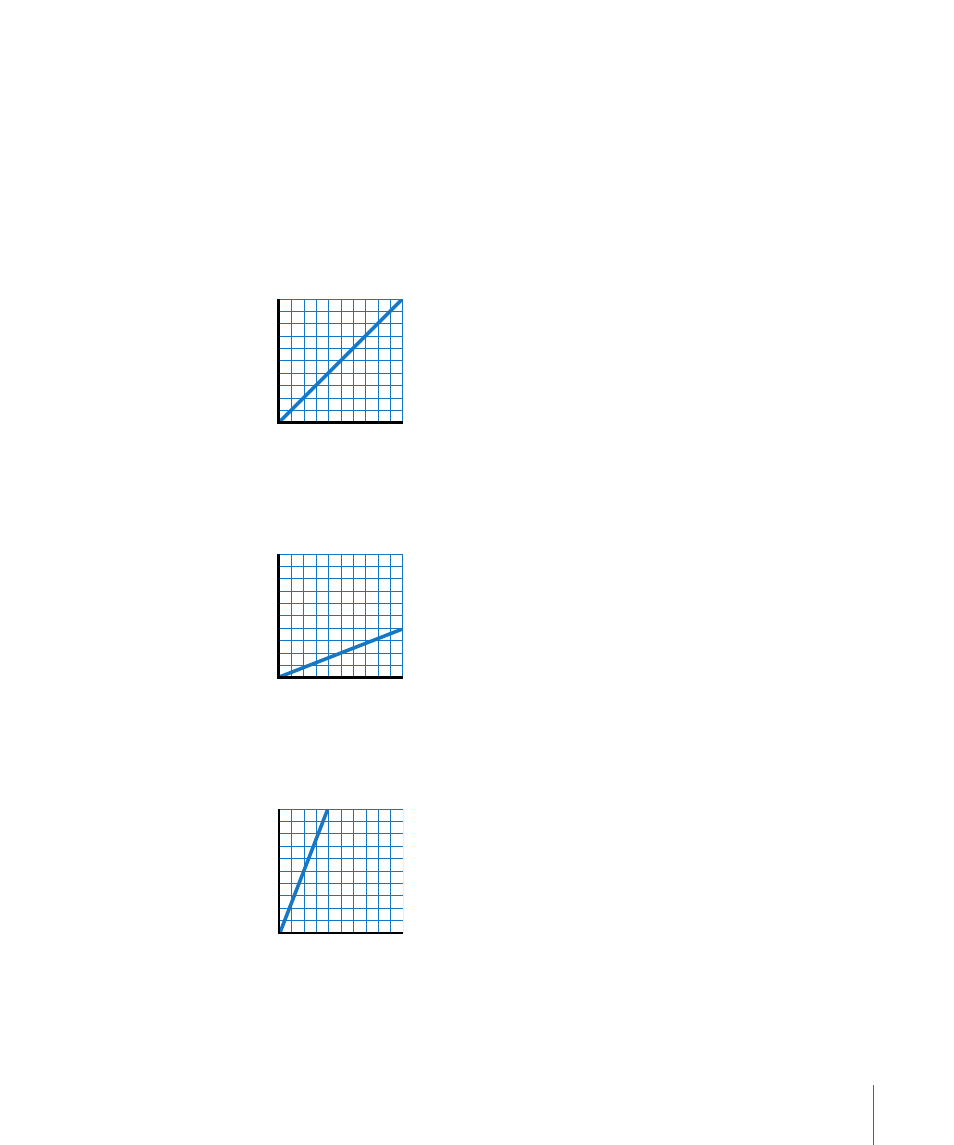
The following illustrations show how changes to the keyframe graph affect the speed of
a clip in the Timeline. In each graph, the vertical axis represents media time, where each
tick mark up is a successive frame of your video clip. The horizontal axis represents the
Timeline, where each tick mark represents the duration of one frame playing at the
sequence frame rate.
• Linear time (100 percent speed): This is represented by a straight, upward-sloping diagonal
line, in which one frame of a video clip plays in the space of one frame of the Timeline.
This is real time.
Sequence time
Linea
r time
Sour
ce time
• Slow motion (less than 100 percent speed): Slow motion is represented by a line with a
more gradual slope, in which one frame of a video clip may play over perhaps three
frames of the Timeline.
Sequence time
Slow motion
Sour
ce time
• Fast-forward (greater than 100 percent speed): Fast-forward speed can be seen as a
steeper line, in which several frames of a video clip play in the space of one frame of
the Timeline.
Sequence time
Fast-f
or
w
ar
d
Sour
ce time
1165
Chapter 69
Changing Clip Speed