Apple Motion 3 User Manual
Page 1142
1142
Chapter 13
Working with Audio
Graph Range: Sets the initial range of frequency values to be analyzed by the
behavior. Can be set to All Frequencies, Bass, Mid, or Treble. The choice of display
affects the frequency range of the Low Frequency and High Frequency parameters
below.
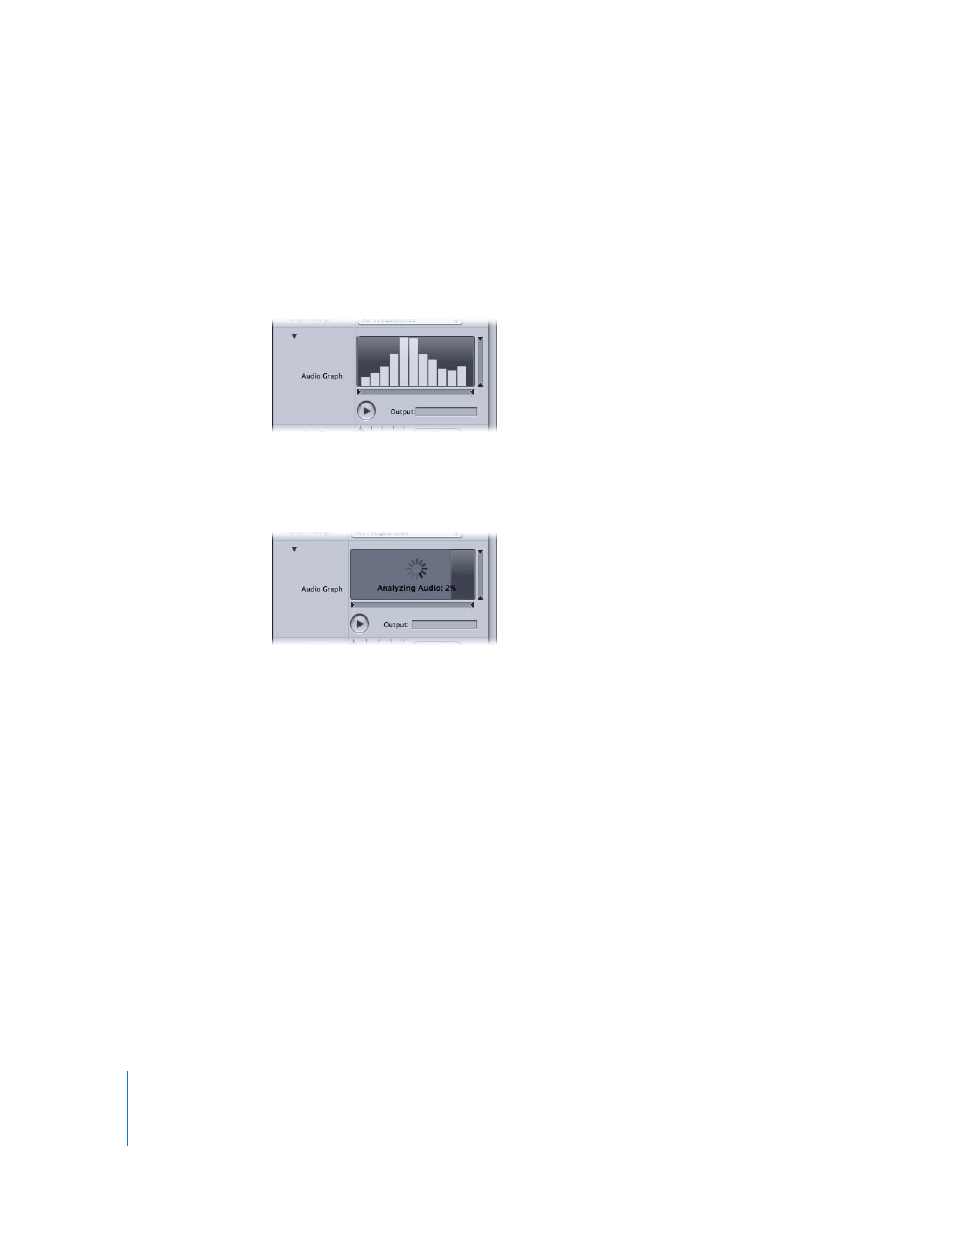
Audio Graph: Displays a visual representation of the Source Audio data analyzed by
the behavior per frame.
During playback initiated by the Play button beneath the Audio Graph, the selected
Source Audio data is displayed. If audio analysis is being performed, progress is
displayed in the Audio Graph area as shown below.
The values of Low Frequency, High Frequency, Floor, and Ceiling can be set visually
using the graph, or set numerically using the parameters directly to isolate certain
frequencies and values for analysis.
Low Frequency: Sets the low frequency threshold of audio analysis. Only audio
frequencies above this value will be analyzed. Values range from 1 Hz to 22,050 Hz.
High Frequency: Sets the high frequency threshold of audio analysis. Only audio
frequencies below this value will be analyzed. Values range from 1 Hz to 22,050 Hz.
Floor: Sets the minimum value of audio input, below which results are ignored. Values
range from 0 to 1.
Ceiling: Sets the maximum value of audio input, above which results are ignored.
Values range from 0 to 1.
Smoothness: Sets the window size to smooth the result curve. Any value other than 0
triggers a keyframe reduction with an error tolerance of 1%. Values range from 0 to 10.
This parameter is only available if Respond To is set to Amplitude.