Ap traffic detail report – H3C Technologies H3C Intelligent Management Center User Manual
Page 649
627
AP traffic detail report
This report displays traffic statistics for individual APs and the top 10 APs with the highest wired and
wireless traffic volumes. These statistics help with capacity planning for future scalability needs.
To view an AP traffic detail report, configure the following parameters:
•
Parameter "Begin Time and End Time"—Select a statistics collection time range from the list. You
can select a specific time range, such as Last Hour, Last Day, Last Week, or Last Month, or
select Custom Range, and then specify the start time and end time manually.
•
Location—Select a specific location view for statistics collection, or select All AP Devices.
•
Begin Time/End Time—These two parameters appear only when you select Custom Range. Click
the field next to Begin Time/End Time to select the start time/end time from the calendar that
appears, in the format of YYYY-MM-DD hh:mm. The end time must be later than the start time.
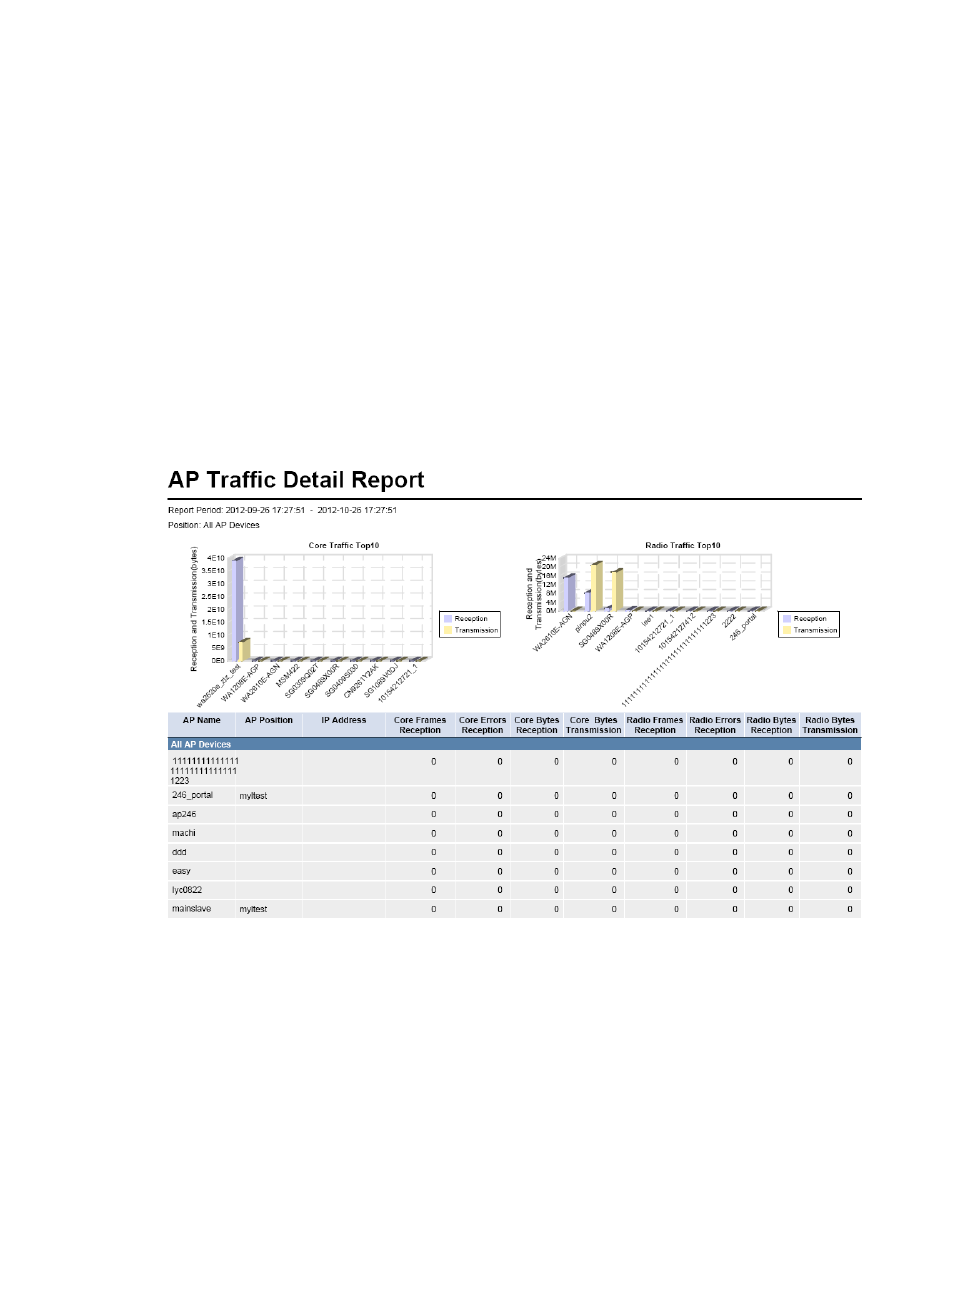
shows an example AP traffic detail report.
Figure 90 AP traffic detail report
AP traffic detail report parameters:
•
Report Period—Time range during which the statistics are collected.
•
Location—Name of the location view for which the statistics are collected or All AP Devices.
AP traffic detail report fields:
•
Core Traffic Top 10—Displays the top 10 APs with the highest wired traffic volumes in a bar chart.
•
Core Traffic Top 10—Displays the top 10 APs with the highest wireless traffic volumes in a bar
chart.
•
AP Name—Access point name.
•
Location—Location view to which the AP belongs.