Viewing the client count details, Viewing the topn clients – H3C Technologies H3C Intelligent Management Center User Manual
Page 61
39
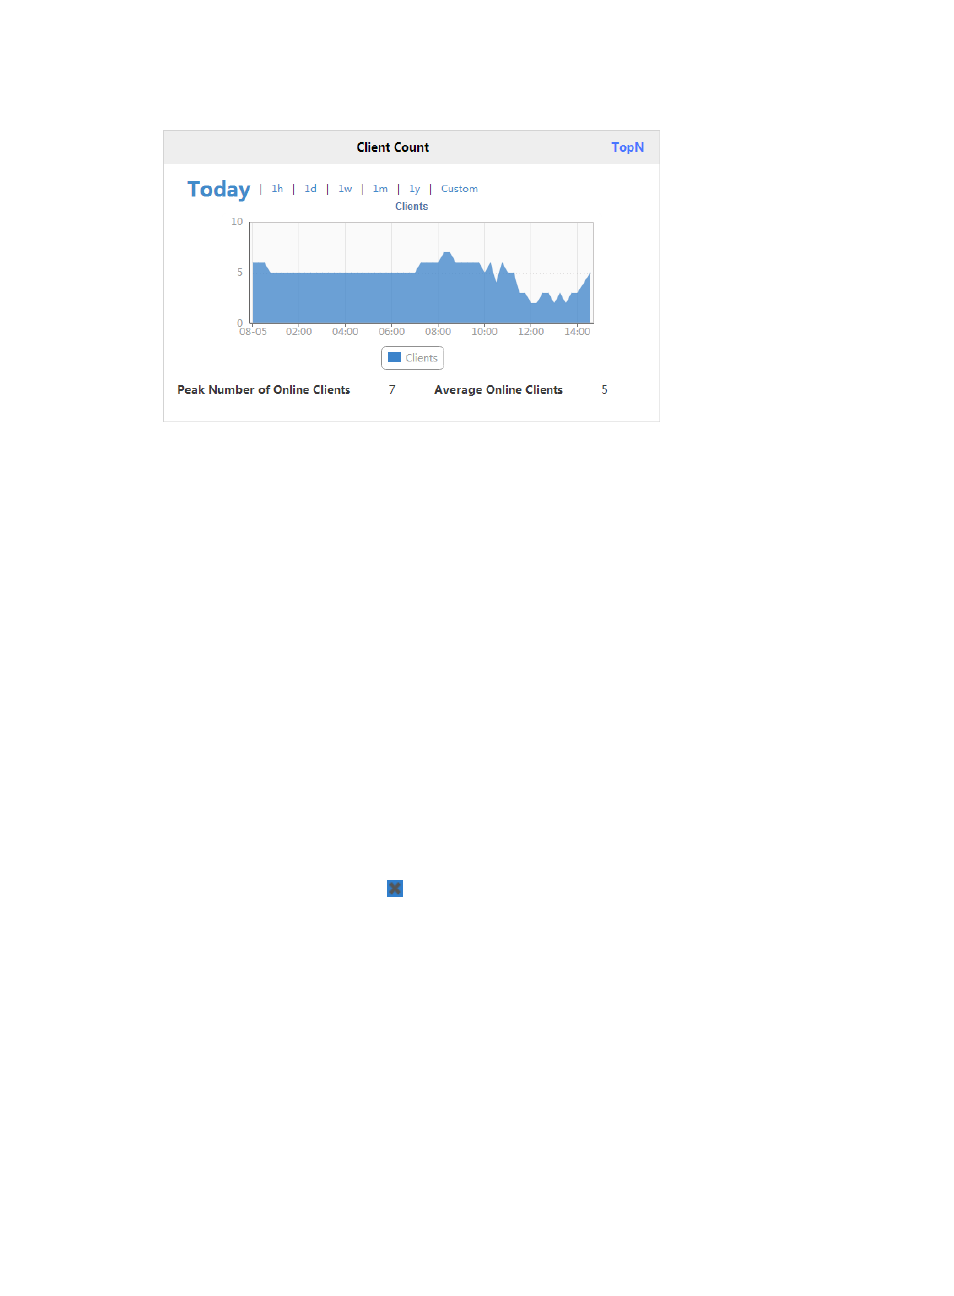
Figure 40 Client Count
The horizontal axis represents the time range, and the vertical axis represents the number of clients.
The time intervals in the horizontal axis automatically adjust to the specified time range.
You can view the changes in the number of online clients within a specific time range. Options are
Today, 1h, 1d, 1w, 1m, 1y, and Custom.
If you select Custom, set the start time and the end time:
1.
Click Custom.
2.
In the Custom window that appears, enter a start time and end time, or select the start time/end
time from the calendar that appears, in the format of YYYY-MM-DD hh:mm. The end time must
be later than the start time.
3.
Click Query.
Changes in the number of online clients within the specified time range are displayed in the
trend graph.
Viewing the client count details
1.
Click Clients on top of the Client Count trend graph.
The Details window appears. It displays the number of online clients at a specific time in a list.
2.
To close the window, click .
Viewing the TopN clients
The TopN Clients page is shown in
The TopN Clients page contains the following lists:
•
TopN Locations by Clients
The list shows the TopN location views with the most clients, in descending order. Click the
name of a location view to display the subviews and devices contained in the location view.
Click the number of clients to display the list of clients in the location view.
•
TopN SSIDs by Clients