Ap threat level statistics – H3C Technologies H3C Intelligent Management Center User Manual
Page 50
28
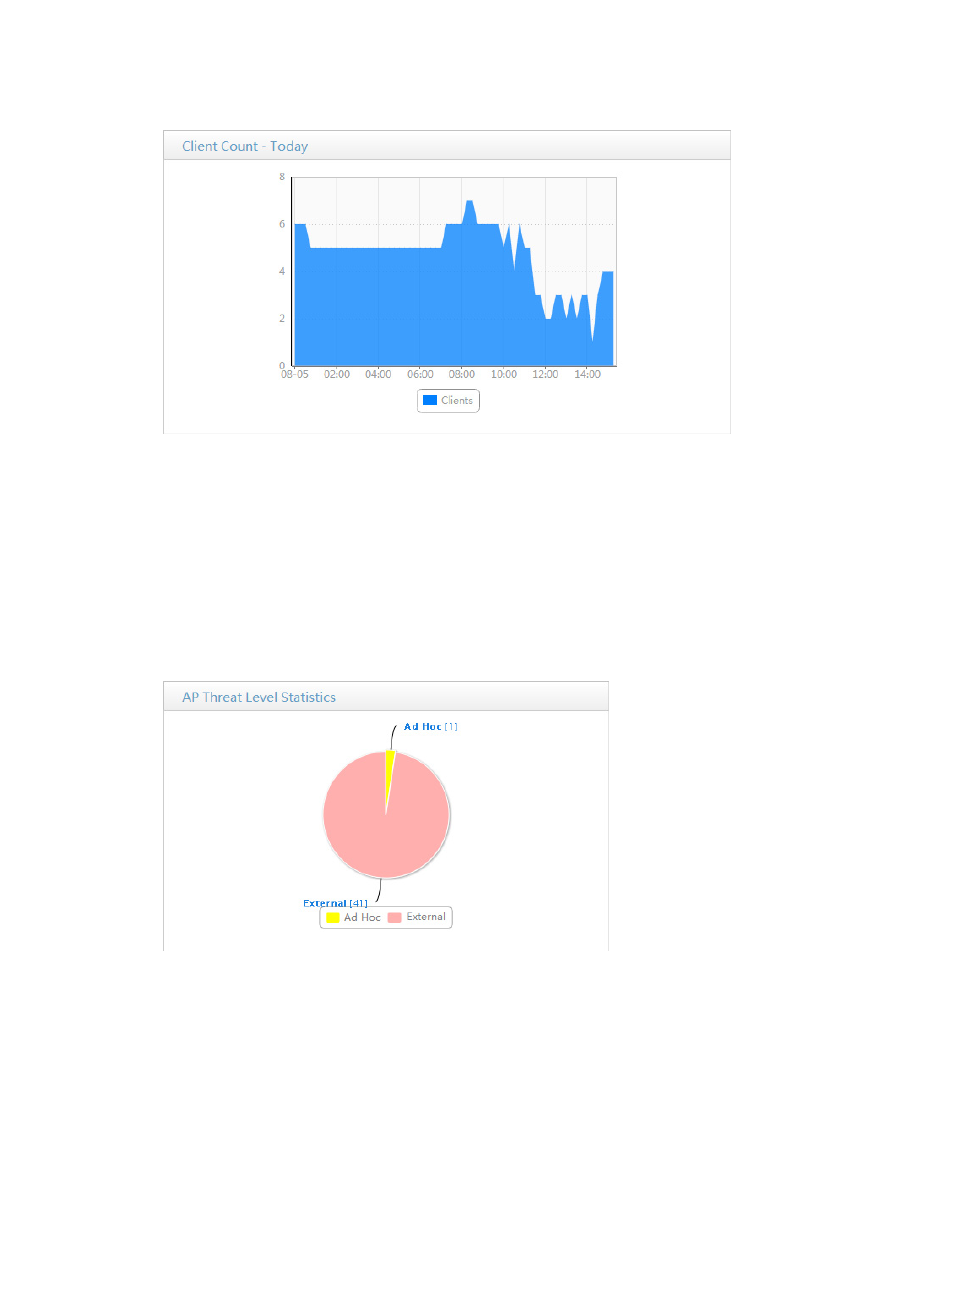
Figure 25 Client Count – Today
The horizontal axis represents time, and the vertical axis represents the number of online clients. The
time intervals in the horizontal axis automatically adjust to the length of time.
AP Threat Level Statistics
Before customizing this widget, deploy the WIPS module.
This widget shows in a pie chart (
) by AP all APs that are detected by WIPS.
Figure 26 AP Threat Level Statistics
The AP type is defined by the WIPS module, including:
•
Ad Hoc
•
Authorized
•
Rogue
•
Misconfigured
•
External
•
Potential-Authorized
•
Potential-Rogue
See also other documents in the category H3C Technologies Safety:
- H3C SecPath L1000-A Load Balancer (8 pages)
- H3C SecPath M9000 Series (42 pages)
- H3C Device Manager (191 pages)
- H3C SecPath U200-A U200-M U200-S (19 pages)
- H3C SecPath F100-C-SI (206 pages)
- H3C SecPath U200-A U200-M U200-S (57 pages)
- H3C SecPath U200-A U200-M U200-S (182 pages)
- H3C SecPath U200-CA U200-CM U200-CS (95 pages)
- H3C SecPath U200-A U200-M U200-S (198 pages)
- H3C SecPath U200-A U200-M U200-S (80 pages)
- H3C SecPath U200-A U200-M U200-S (326 pages)
- H3C SecPath F100-C-SI (126 pages)
- H3C SecPath U200-A U200-M U200-S (225 pages)
- H3C SecPath F100-C-SI (68 pages)
- H3C SecPath F100-C-SI (99 pages)
- H3C SecPath F100-C-SI (273 pages)
- H3C SecPath F100-C-SI (234 pages)
- H3C SecPath F100-C-SI (490 pages)
- H3C SecPath U200-A U200-M U200-S (397 pages)
- H3C SecPath F100-C-SI (967 pages)
- H3C SecBlade FW Cards (938 pages)
- H3C SecPath U200-CA U200-CM U200-CS (84 pages)
- H3C SecPath F5000-A5 Firewall (121 pages)
- H3C SecPath F5000-C Firewall (2 pages)
- H3C SecPath F5040 (86 pages)
- H3C SecPath F5000-C Firewall (4 pages)
- H3C SecBlade FW Cards (12 pages)
- H3C SecBlade FW Cards (16 pages)
- H3C SecBlade FW Cards (6 pages)
- H3C SecPath U200-CA U200-CM U200-CS (45 pages)
- H3C SecBlade FW Cards (21 pages)
- H3C SecBlade IPS Cards (31 pages)
- H3C SecPath U200-CA U200-CM U200-CS (18 pages)
- H3C SecBlade IPS Cards (85 pages)
- H3C SecBlade IPS Cards (219 pages)
- H3C SecBlade SSL VPN Cards (21 pages)
- H3C SecBlade NetStream Cards (349 pages)
- H3C SecPath L1000-A Load Balancer (66 pages)
- H3C SecPath L1000-A Load Balancer (196 pages)
- H3C SecPath L1000-A Load Balancer (114 pages)
- H3C SecPath L1000-A Load Balancer (165 pages)
- H3C SecPath L1000-A Load Balancer (278 pages)
- H3C SecPath U200-A U200-M U200-S (83 pages)
- H3C SecPath L1000-A Load Balancer (8 pages)
- H3C VMSG VFW1000 (36 pages)