Total clients, N in, Figure 36 – H3C Technologies H3C Intelligent Management Center User Manual
Page 58
36
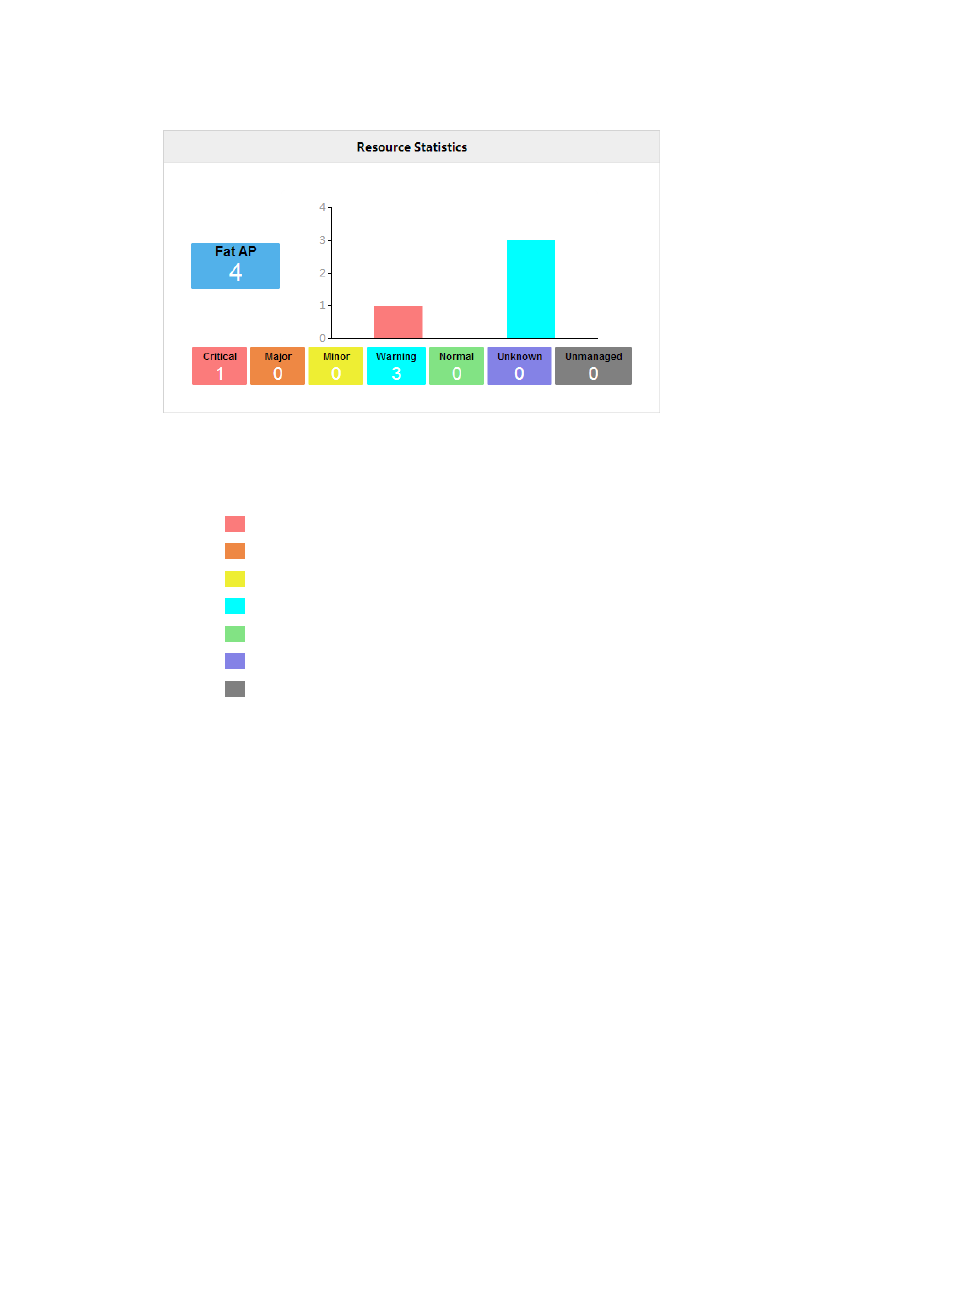
Figure 36 Fat AP resource statistics
•
The vertical axis shows the number of fat APs in the wireless network. The colored squares blow
the histogram show the number of fat APs for each alarm level.
•
Each color reflects a different alarm level:
{
Critical
{
Major
{
Minor
{
Warning
{
Normal
{
Unknown
{
Unmanaged
•
If you click a colored square, you can view all fat APs for that alarm level.
Total Clients
The Total Clients area displays total clients by type, vendor, and operating system in pie charts and
forms one by one at an interval of 5 seconds.
See also other documents in the category H3C Technologies Safety:
- H3C SecPath L1000-A Load Balancer (8 pages)
- H3C SecPath M9000 Series (42 pages)
- H3C Device Manager (191 pages)
- H3C SecPath U200-A U200-M U200-S (19 pages)
- H3C SecPath F100-C-SI (206 pages)
- H3C SecPath U200-A U200-M U200-S (57 pages)
- H3C SecPath U200-A U200-M U200-S (182 pages)
- H3C SecPath U200-CA U200-CM U200-CS (95 pages)
- H3C SecPath U200-A U200-M U200-S (198 pages)
- H3C SecPath U200-A U200-M U200-S (80 pages)
- H3C SecPath U200-A U200-M U200-S (326 pages)
- H3C SecPath F100-C-SI (126 pages)
- H3C SecPath U200-A U200-M U200-S (225 pages)
- H3C SecPath F100-C-SI (68 pages)
- H3C SecPath F100-C-SI (99 pages)
- H3C SecPath F100-C-SI (273 pages)
- H3C SecPath F100-C-SI (234 pages)
- H3C SecPath F100-C-SI (490 pages)
- H3C SecPath U200-A U200-M U200-S (397 pages)
- H3C SecPath F100-C-SI (967 pages)
- H3C SecBlade FW Cards (938 pages)
- H3C SecPath U200-CA U200-CM U200-CS (84 pages)
- H3C SecPath F5000-A5 Firewall (121 pages)
- H3C SecPath F5000-C Firewall (2 pages)
- H3C SecPath F5040 (86 pages)
- H3C SecPath F5000-C Firewall (4 pages)
- H3C SecBlade FW Cards (12 pages)
- H3C SecBlade FW Cards (16 pages)
- H3C SecBlade FW Cards (6 pages)
- H3C SecPath U200-CA U200-CM U200-CS (45 pages)
- H3C SecBlade FW Cards (21 pages)
- H3C SecBlade IPS Cards (31 pages)
- H3C SecPath U200-CA U200-CM U200-CS (18 pages)
- H3C SecBlade IPS Cards (85 pages)
- H3C SecBlade IPS Cards (219 pages)
- H3C SecBlade SSL VPN Cards (21 pages)
- H3C SecBlade NetStream Cards (349 pages)
- H3C SecPath L1000-A Load Balancer (66 pages)
- H3C SecPath L1000-A Load Balancer (196 pages)
- H3C SecPath L1000-A Load Balancer (114 pages)
- H3C SecPath L1000-A Load Balancer (165 pages)
- H3C SecPath L1000-A Load Balancer (278 pages)
- H3C SecPath U200-A U200-M U200-S (83 pages)
- H3C SecPath L1000-A Load Balancer (8 pages)
- H3C VMSG VFW1000 (36 pages)