The graph editor – Adobe After Effects CS4 User Manual
Page 217
211
USING AFTER EFFECTS CS4
Animation and keyframes
Last updated 12/21/2009
When the stopwatch is active for a specific property, After Effects automatically sets or changes a keyframe for the
property at the current time whenever you change the property value. When the stopwatch is inactive for a property,
the property has no keyframes. If you change the value for a layer property while the stopwatch is inactive, that value
remains the same for the duration of the layer.
If you deselect the stopwatch, all keyframes for that layer property are deleted, and the constant value for the property
becomes the value at the current time. Don’t deselect the stopwatch unless you’re sure that you want to permanently
delete all of the keyframes for that property.
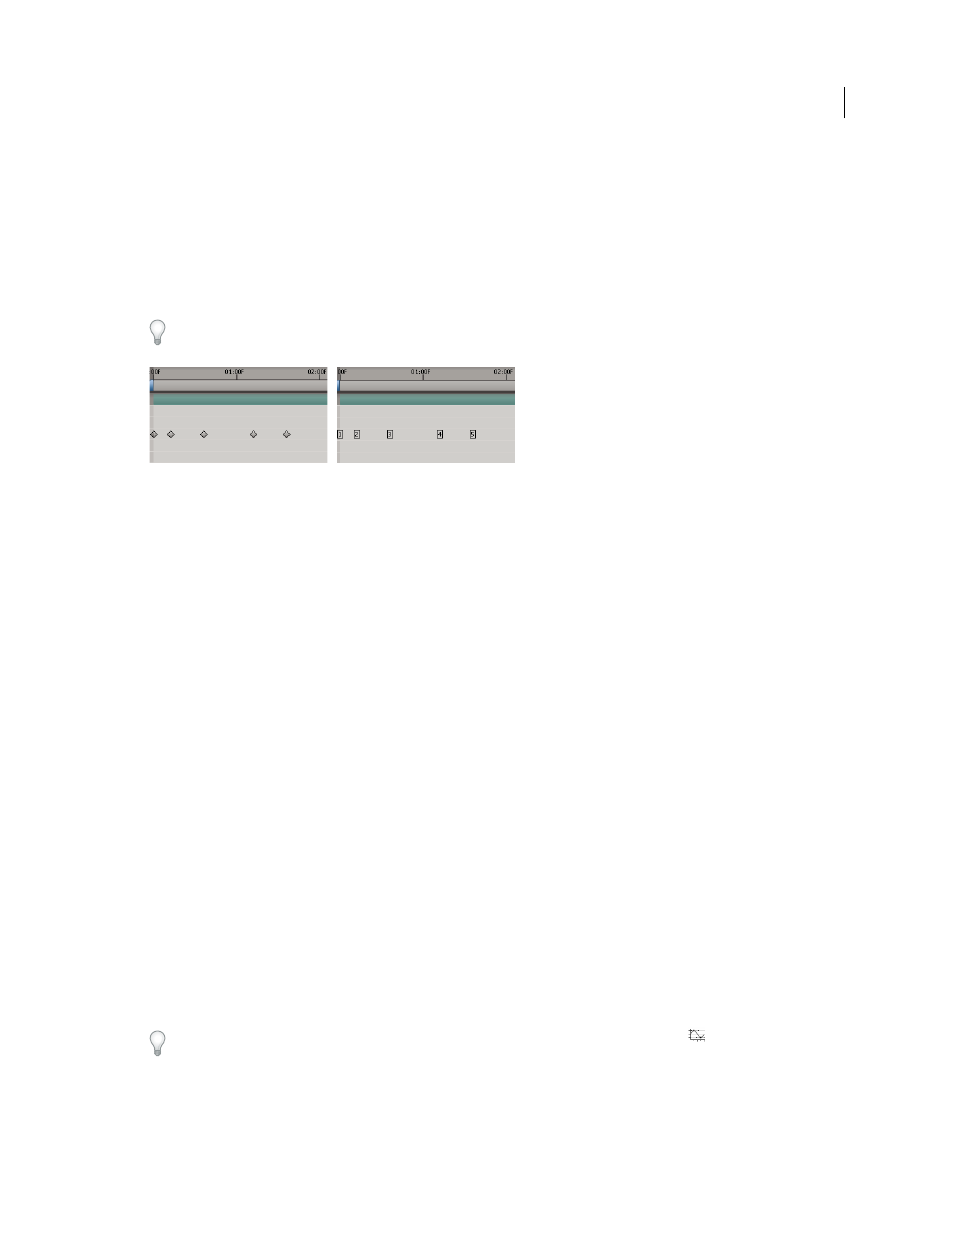
Change the keyframe icons in layer bar mode to numbers by choosing Use Keyframe Indices in the Timeline panel
menu.
Keyframes as icons compared to keyframes as numbers
Note: When a layer property that contains keyframes is collapsed, gray dots (summary keyframe indicators) for the
property group show that there are keyframes contained within it.
Some tools, such as Motion Sketch and the Puppet tools, automatically set keyframes for you to match motion that you
sketch.
Expressions
Expressions use a scripting language based on JavaScript to specify the values of a property and to relate properties to
one another. You can create simple expressions by connecting properties with the pick whip. (See “
Online animation resources
Aharon Rabinowitz provides some video tutorials that introduce animation as part of the
including “How Does Computer Animation Work?” and “What is interpolation?”
provides links to information about the theory and practice of animation, especially
character animation.
For a step-by-step tutorial that demonstrates the animation of individual layers from a Photoshop (PSD) file, see the
on the Peachpit Press website.
The Graph Editor
The Graph Editor represents property values using a two-dimensional graph, with composition time represented
horizontally (from left to right). In layer bar mode, on the other hand, the time graph represents only the horizontal
time element, without showing a graphical, vertical representation of changing values.
To toggle between layer bar mode and Graph Editor mode, click the Graph Editor button
in the Timeline panel
or press Shift+F3.