Metrohm 746 VA Trace Analyzer User Manual
Page 496
6.9 Content calculation
746 VA Trace Analyzer / 747 VA Stand
6-33
3
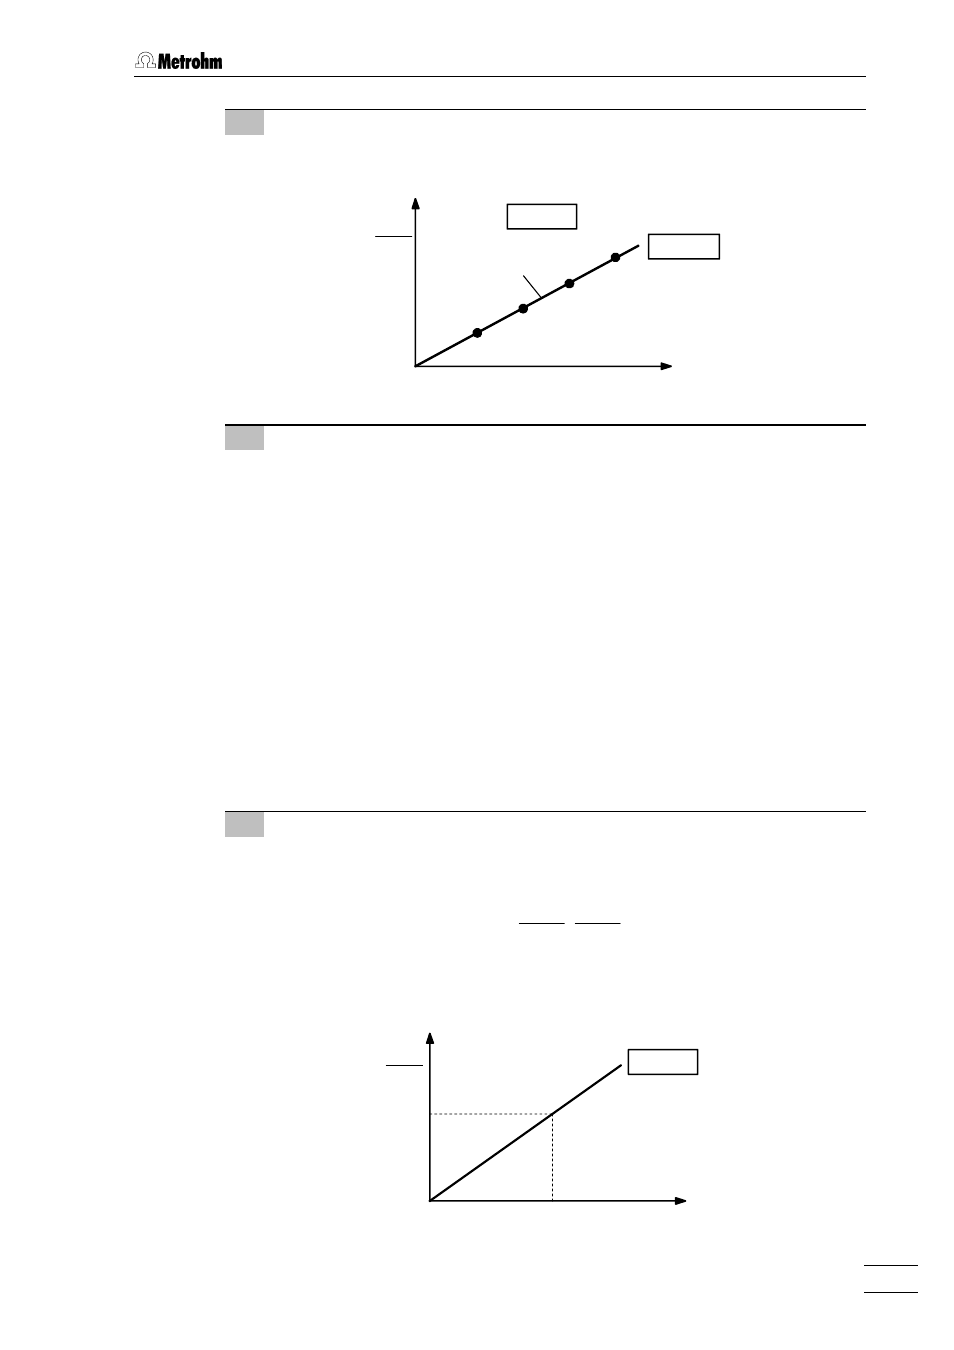
Display of the calibration curve
The 746 VA Trace Analyzer displays and plots the calibration curve
EV
a
/
EV
r
vs
ρ
eff,a
eff,a
/
ρ
eff,r
eff,r
:
0
0
0/linear
Slope = Prop.fact.
int.std.
4
Measurement of the sample solution
The internal standard is added to the sample solution with the unknown
mass concentration
ρ
eff,a,s
eff,a,s
of the sample. Finally, analyte and reference
substance are measured one or more times. This gives:
EV
a,s
Evaluation quantity for analyte of the sample
EV
r,s
Evaluation quantity for reference substance of the
sample
EV
s
.mean
Mean value of the evaluation quantities for sample
(for analyte and reference substance)
Std.dev.
Standard deviation of the individual value
EV
s
(for analyte and reference substance)
EV
a,s
/
EV
r,s
Ratio of the evaluation quantities for sample
ρ
eff,r,s
eff,r,s
Effective mass concentrations of the reference sub-
stance for the sample solutions (calculated from
ρ
rr
taking the dilution into account)
5
Calculation of the mass concentration
ρρ
eff,a,s
eff,a,s
The sought mass concentration
ρ
eff,a,s
eff,a,s
of the sample is calculated using the
following formula:
In the graphical representation of the calibration curve,
EV
a,s
.mean/
EV
r,s
.mean
and the calculated ratio of the mass concentrations
ρ
eff,a,s
eff,a,s
/
ρ
eff,r,s
eff,r,s
are marked:
int.std.
ρ
eff,a,s
eff,a,s
=
b
ρ
eff,a,s
eff,a,s
ρ
eff,a
eff,a
/
ρ
eff,r
eff,r
EV
r,s
EV
a,s
.mean/EV
r,s
.mean
ρ
eff,a
eff,a
/
ρ
eff,r
eff,r
ρ
eff,a,s
eff,a,s
/
ρ
eff,r,s
eff,r,s
EV
a,s
EV
r
EV
a
EV
r
EV
a