Metrohm 746 VA Trace Analyzer User Manual
Page 107
4 Introduction to the operation
746 VA Trace Analyzer / 747 VA Stand
4-22
•
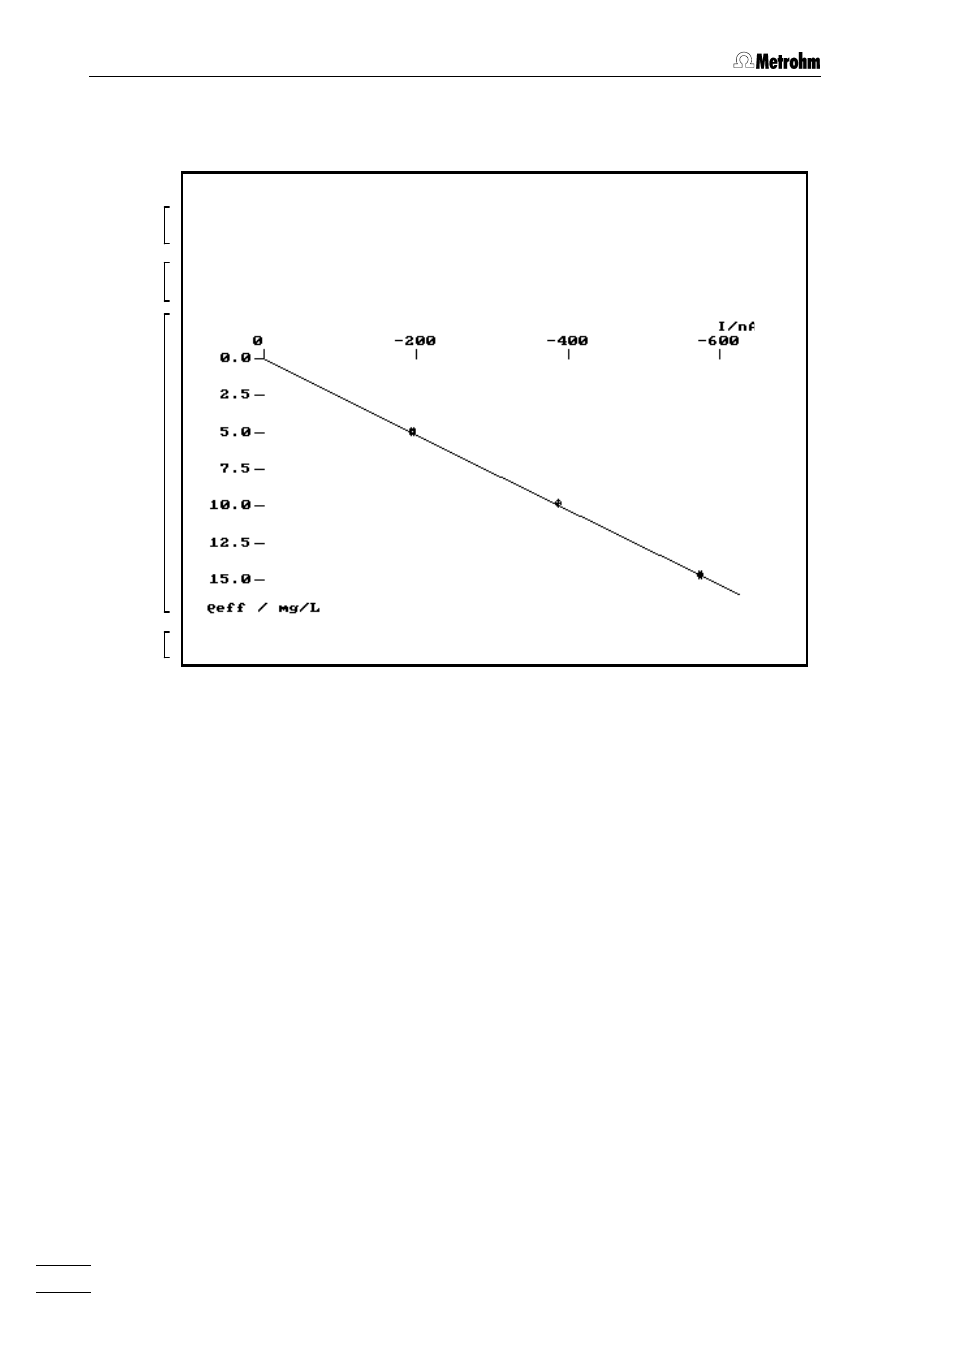
The last curve to be printed out is the calibration curve for the standard
addition:
================== METROHM 746 VA TRACE ANALYZER (5.746.0101) ==================
Method : TESTPb User : Date : 1997-03-20
Mode : DPMODE Determ. : 03201614 Time : 16:14:53
Run : 1 Sample :
Standard addition curve
Curve type : lin Slope : -3.907e-05 Mean.dev. : 2.137e-09
Mode : const Y.reg : -1.957e-07
Substance : Pb
•
The printout of the standard addition curve comprises the following
parts:
1
Data of determination
Name of the method, user, date and time of the
recording, measurement mode, name of the
determination, run number, sample identification
2
Data of standard addition Curve type, addition mode, slope of the standard
addition curve, current value
Y.reg for the
sample calculated from the standard addition
curve, mean deviation
Mean.dev. of the
measured values about the standard addition
curve
3
Standard addition curve Measured points (mean value of the measured
peak currents), calculated standard addition curve,
current axis, axis for effective mass concentration
in the measuring vessel
4
Substance
Name of substance
•
You will find further information regarding the printout of the standard
addition curves in section 5.5.3 "CURVES" and section 5.6.5 "DOCU-
MENTATION".
•
This concludes the lead determination. In the following sections you will
learn how you can subsequently store the recorded determination
(section 4.2.7) and what possibilities you have available to view and
process the measured data on the dialog pages "RESULTS" (section
4.2.8) and "CURVES" (section 4.2.9).
4
3
2
1