Metrohm 746 VA Trace Analyzer User Manual
Page 248
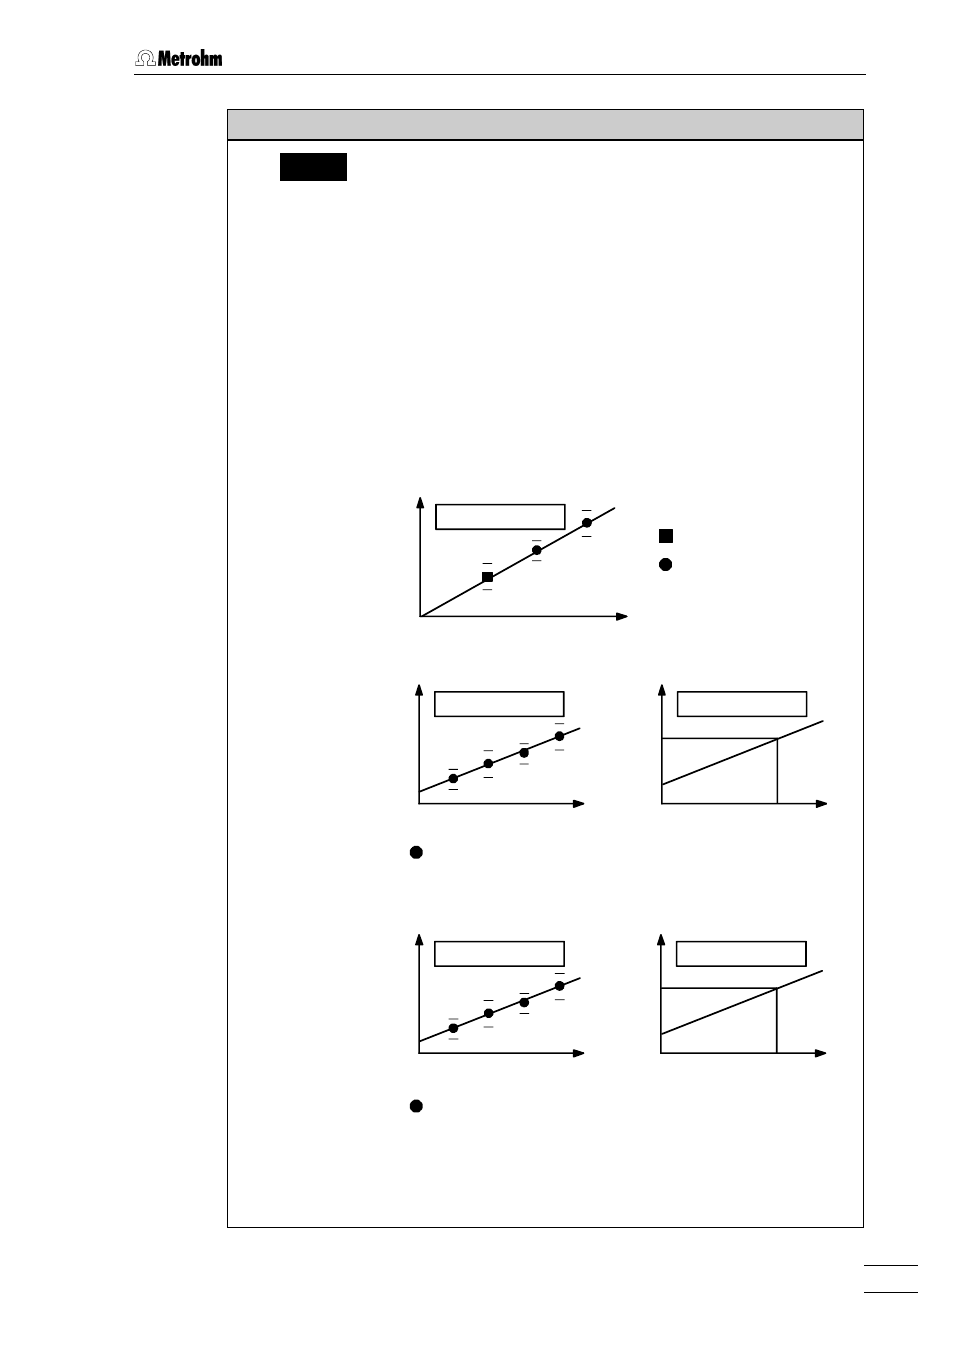
5.5.3 CURVES
746 VA Trace Analyzer / 747 VA Stand
5-97
Softkeys
Meaning
Calibr.
Display of the calibration curve and the mass concentration of the
substance calculated from it for the sample. The axes for standard
addition and calibration curve have the following meaning:
EV
Evaluation value (current I, power P or time t)
ρρ
eff
Effective mass concentration of the selected sub-
stance in the measuring vessel
With the internal standard, the following axes are shown:
EV
a
/EV
r
Ratio of the evaluation values of analyte (a = analyte)
and reference substance (r = reference)
ρρ
a
/
ρρ
r
Ratio of the effective mass concentrations of analyte
(a = analyte) and reference substance (r = refer-
ence) in the measuring vessel
The curve representation depends on the selected calibration tech-
nique
Technique
and the run mode
Run mode
:
•
Standard addition (see also section 6.9.4):
ρρ
eff
eff
EV
std.add., determ.
Sample
Standard additions
–
±
Standard deviation
(if available)
•
Calibration curve (see also section 6.9.5):
ρρ
eff
eff
EV
cal.crv., calibr.
ρρ
eff
eff
EV
cal.crv., determ.
Calibration points
–
±
Standard deviation
The measured value is
plotted.
•
Internal standard (see also section 6.9.6):
ρρ
a
a
//
ρρ
rr
EV
a
/EV
r
int.std., calibr.
int.std., determ.
EV
a
/EV
r
ρρ
a
a
//
ρρ
rr
Calibration points
–
±
Deviation
The measured value is
plotted.
The results of the calibration are also shown for all curves (for details,
see under
Coefficients
on the "SUBSTANCES/Calibration" page,
section 5.6.3).