Metrohm 746 VA Trace Analyzer User Manual
Page 139
4 Introduction to the operation
746 VA Trace Analyzer / 747 VA Stand
4-54
9
Printout of reports and curves
•
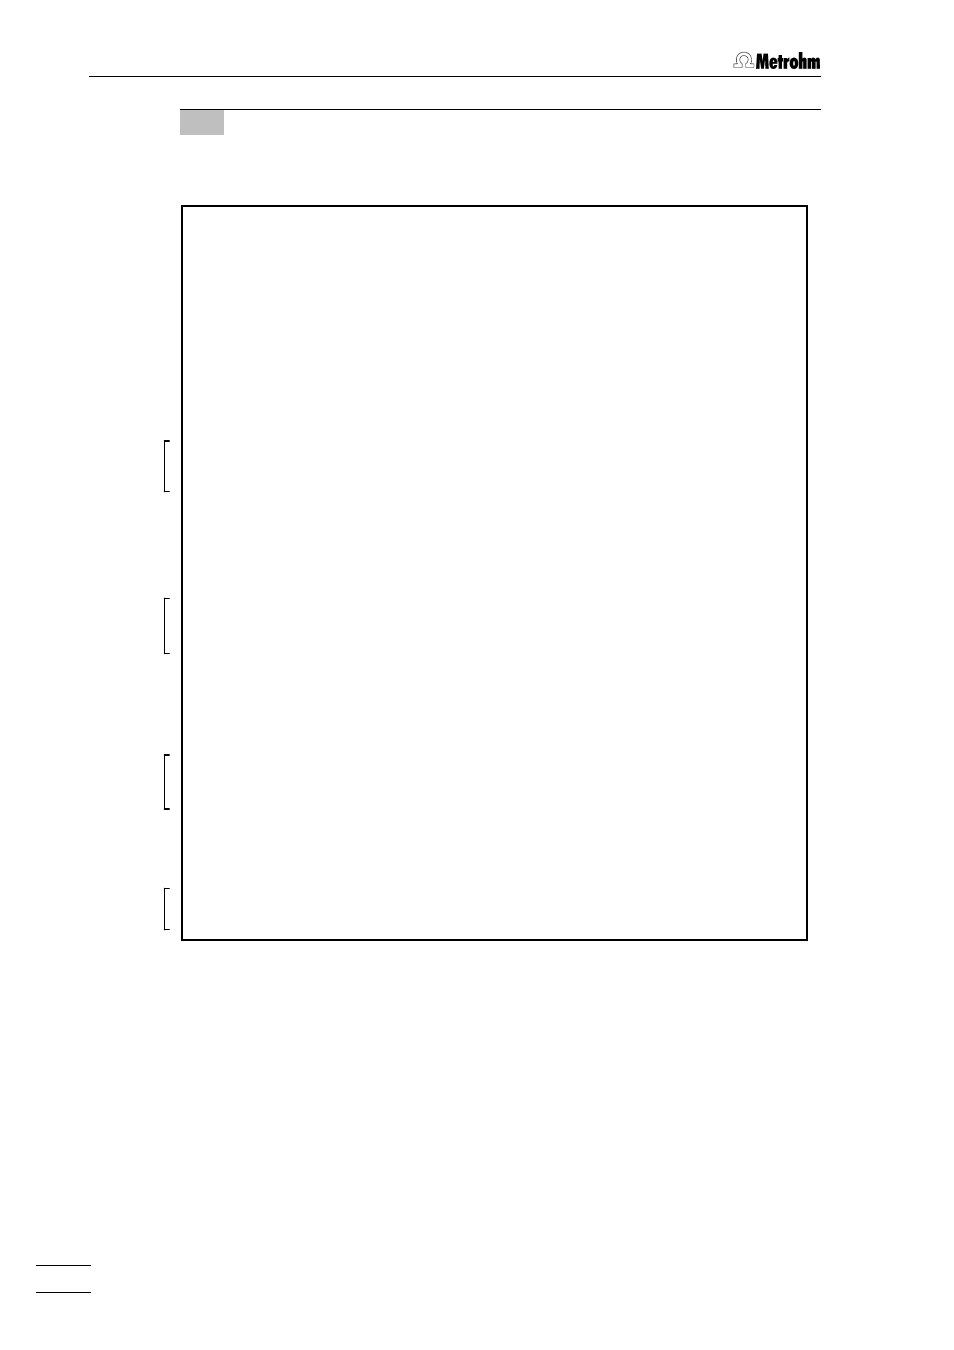
On completion of the program, the reports and curves entered on the
"DOCUMENTATION" page are put out on the printer:
================== METROHM 746 VA TRACE ANALYZER (5.746.0101) ==================
Determ. : 12161627 User: Date: 1996-12-16
Modified : no Run : 5 Time: 16:27:07
Sample table: -
--------------------------------------------------------------------------------
Pos. Ident.1/S1 Ident.2/S2 Ident.3/S3 Method.call Sample size/S0
Drink water 10 mL
--------------------------------------------------------------------------------
Method : INTSTD
Title : Pb determination with calibration curve
Remark1 :
Remark2 :
--------------------------------------------------------------------------------
Substance : Pb Comments
Mass conc.: 13.02 ug/L Mass : 130.2 ng ——————————————————
MC.dev. : 0.603 ug/L (4.63%) Add.mass : - dev. estimated
Cal.dev. : 0.326 ug/L (2.5%) V0.sample: 10 mL
VR U/mV I/nA I.mean Std.dev. I.delta Comments
——— ————— —————— —————— ——————— ——————— ——————————————————
00 -409 17.66 17.74 0.1623
01 -409 17.92
02 -409 17.63
Substance : CdRef Comments
Mass conc.: - Mass : - ——————————————————
MC.dev. : - Add.mass : -
Cal.dev. : - V0.sample: -
VR U/mV I/nA I.mean Std.dev. I.delta Comments
——— ————— —————— —————— ——————— ——————— ——————————————————
00 -583 23.78 23.90 0.1073
01 -583 24.00
02 -584 23.92
Substance Techn. Y.reg/offset Slope Nonlin. Mean.deviat.
————————— ———————— ———————————— —————————— —————————— ————————————
Pb int.std. 0.5699 0.03553
CdRef int.std.
C# Workg.com.var Remark
—— ————————————— ————————————————
Final results +/- Res.dev. % Comments
————————————————————————————————— ————————————————— ——————————————————
Pb = 13.02 ug/L 0.603 4.63 see Evaluations
•
The full report
Full report
contains not only the usual header (see
section 4.2.6), but also the following important sections:
1
Data for substance
Results of peak evaluations and result for Pb mass
evaluation of Pb
concentration.
2
Data for substance
Only the substance name
CdRef is given, the
evaluation of Cd
other parameters remain blank as they are not
calculated when the calibration curve is recorded.
3
Data for calibration
The proportionality factor determined from the
calibration curve is given.
4
Final results
Final result with formula calculation.
3
1
2
4