Metrohm 746 VA Trace Analyzer User Manual
Page 245
5.5 Operation
746 VA Trace Analyzer / 747 VA Stand
5-94
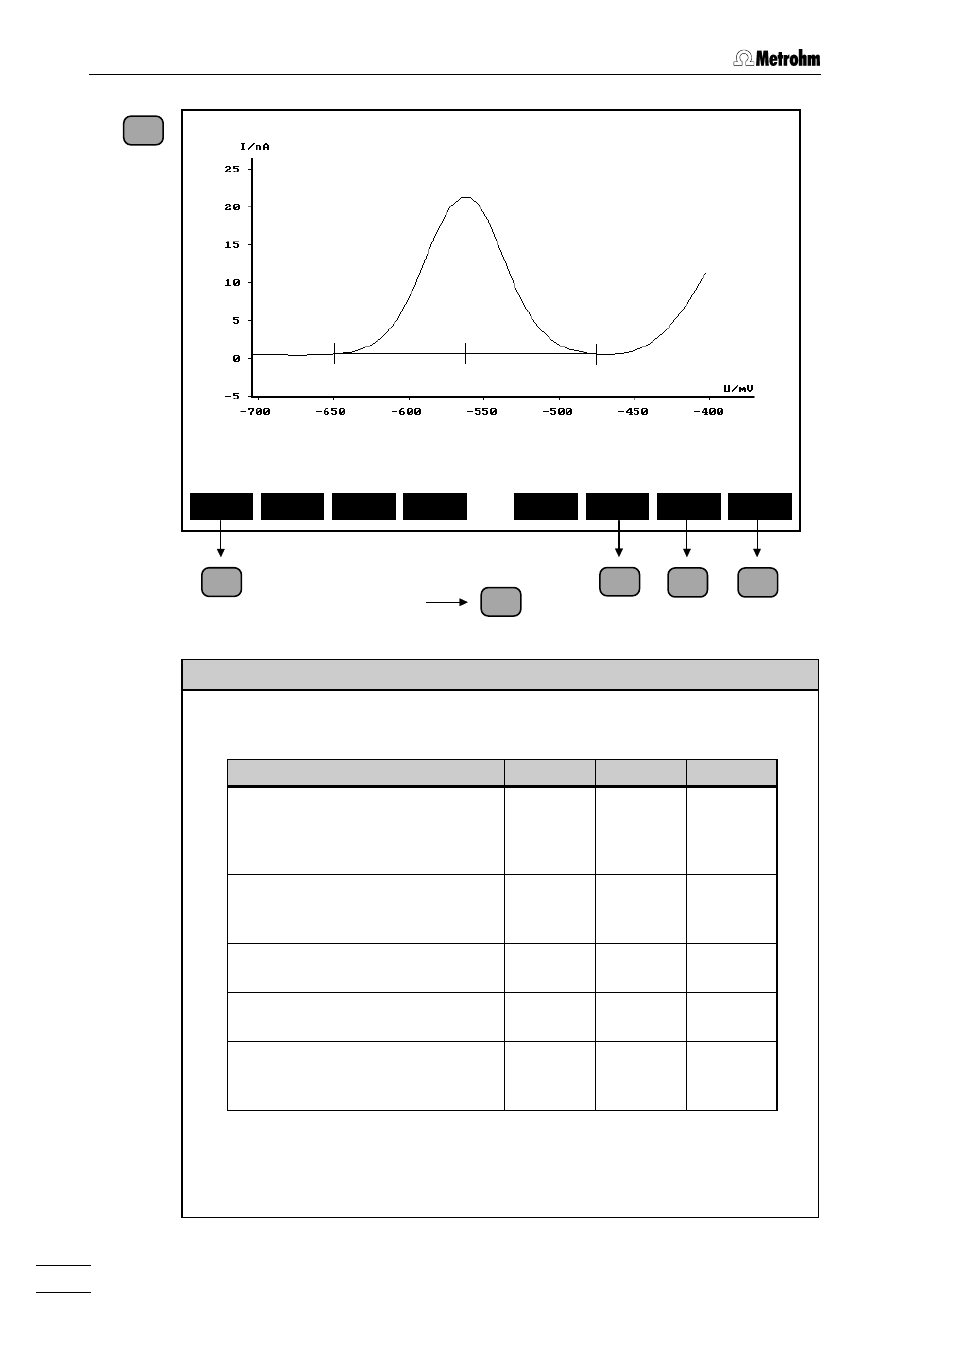
Substance-VR-Curve: XXXXXXXX-XX-smoothed
U.peak : XXXXXX mV dU.front: XXXXXX mV dU.rear: XXXXXX mV
I.peak : XXXXXX xA S.front: XXXXXX S.rear: XXXXXX
P.peak : XXXXXX xW
U.width: XXXXXX mV
Display
segment
Select
subst.
Select
curve
Next
VR
Prev.
VR
Scale
Modify
recogn.
Modify
baseline
Curve display
The representation of the substance curve as well the display of the peak/wave results
depends on the measurement mode selected:
Measurement mode
y axis
x axis
Results
DPMODE, SQWMODE, AC1MODE
DCTMODE with SSWEEP (peaks)
CYCMODE with only 1 ramp (RAMP)
I/xA
U/mV
U.peak
I.peak
P.peak
U.width
DCTMODE with SWEEP (waves)
I/xA
U/mV
U / 2
I.wave
U.width
AC2MODE with evaluation
AC2 abs.
I/xA
U/mV
U / 2
I.abs
AC2MODE with evaluation
AC2 rel.
I/xA
U/mV
U / 2
I.rel
PSAMODE with PSWEEP
t/U / s/V
U/mV
U.peak
t.peak
U.width
In what follows, a substance peak recorded with DPMODE will be used as a curve exam-
ple. However, in most cases the listed functions of the softkeys and the meaning of the
parameters apply to not just this example but also curves with other measurement modes.
Any differences which appear are listed specifically under "Softkeys" or "Parameter".
12
8
9
10
11
15
with cyclic
curves