Metrohm 746 VA Trace Analyzer User Manual
Page 488
6.9 Content calculation
746 VA Trace Analyzer / 747 VA Stand
6-25
ρ
eff,n
eff,n
–
ρ
eff,s
eff,s
Difference in the mass concentrations between
the n
th
spiked sample and the original sample
solution (calculated from the known volumes
V.sample
and
V.add
n
as well as
ρ
std
std
)
3
Determination of the calibration curve for the standard
addition
The parameters for the two possible model functions
y = a + bx
Straight line
y = a + bx + cx
4
Nonlinear curve of 4
th
degree
are determined by the procedure described in section 6.9.3 with y =
EV
and
x =
ρ
eff
eff
–
ρ
eff,s
eff,s
by weighted least squares minimization. These parameters are
displayed on the "RESULTS/Calibrations" page and have the following
meaning:
a
Y.reg/offset
Intercept of calibration curve
b
Slope
Slope of calibration curve in the linear region
c
Nonlin.
Non-linearity factor
4
Calculation of the mass concentration
ρρ
eff,s
eff,s
A requirement for the use of the standard addition is that when
ρ
eff
eff
= 0 the
evaluation quantity
EV
= 0. If 0 is substituted for these two quantities in the
calibration function, the sought mass concentration
ρ
eff,s
eff,s
can be calculated
from the following two equations:
b
ρ
eff,s
eff,s
– a = 0
for y = a + bx
c
ρ
eff,s
eff,s
4
+ b
ρ
eff,s
eff,s
– a = 0
for y =a + bx + cx
4
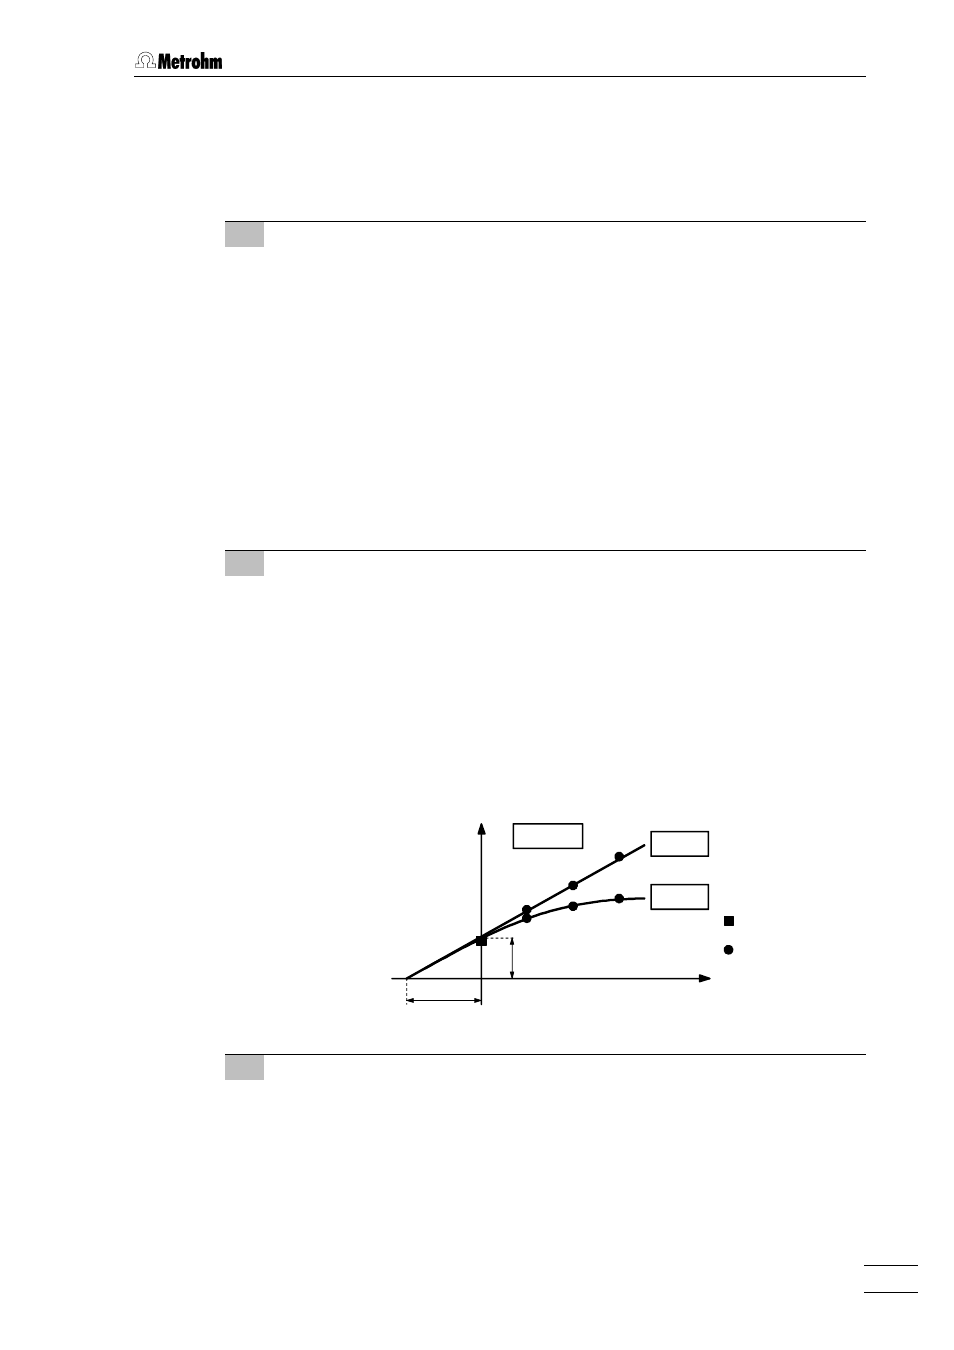
In the graphical representation of the standard addition curve, the sought
mass concentration on the x-axis is given by the distance between the zero
point and the intersection point with the calibration function.
std.add.
a
EV
0
linear
nonlin
5
Display of the standard addition curve
The curve shown above
EV
vs
ρ
eff
eff
–
ρ
eff,s
eff,s
is not displayed and plotted by the
VA Trace Analyzer. Instead, it displays and plots
EV
vs
ρ
eff
eff
in which the
coordinate origin is shifted to the left by the amount
ρ
eff,s
eff,s
. The parameter a in
this representation denotes the value estimated from the curve for the sam-
ple and is thus designated by
Y.reg
.
ρρ
eff,s
eff,s
Sample
Standard solution
ρρ
eff
eff
–
ρρ
eff,s
eff,s