8 height/area calculation – Metrohm 746 VA Trace Analyzer User Manual
Page 482
6.8 Height/area calculation
746 VA Trace Analyzer / 747 VA Stand
6-19
6.8
Height/area calculation
With the aid of the calculated baselines, the evaluation quantity
EV:
is de-
termined for each substance and displayed as a result. Depending on the meas-
urement mode, the following quantities are possible as evaluation quantities:
Measurement
mode
I.wave
I.peak
P.peak
I.abs
I.rel
t.peak
DCT (waves)
n
DCT (peaks),
DP, SQW, AC1,
l
l
CYC (1 ramp)
AC2
l
l
PSA
n
l
adjustable
n
no other choice possible
These evaluation quantities are calculated as follows:
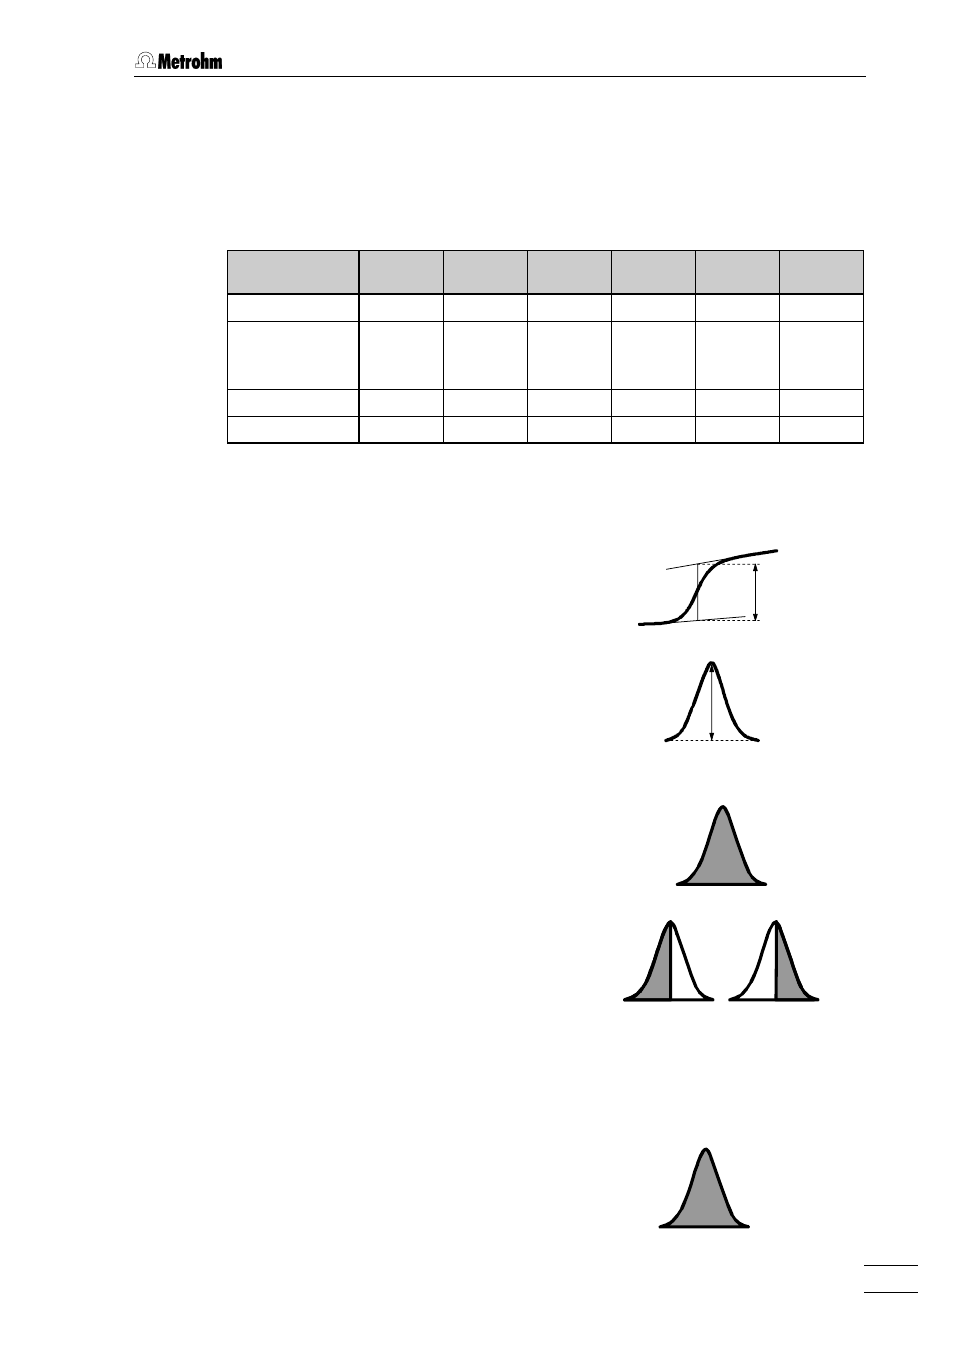
•
I.wave
The wave current
I.wave
is calculated
from the tangents before and after the
wave (details, see section 6.7.2).
I.wave
•
I.peak
The peak height
I.peak
is determined
from the previously calculated baseline
(details, see section 6.7.3) and the ex-
actly interpolated current height at the
peak maximum.
I.peak
•
P.peak
The peak area
P.peak
is determined
from the previously calculated baseline
(details, see section 6.7.3) by integra-
tion.
With a linear baseline with
Scope =
f.half
and
Scope = r.half
, only the
area up to the peak maximum is taken
as an evaluation quantity.
Scope = whole
Scope = f.half
Scope = r.half
•
I.abs / I.rel
With AC2 curves, either the absolute or the relative peak height can be cal-
culated. Details are given in section 6.7.4.
•
t.peak
With PSA curves, the peak area
t.peak
is determined by integration
of the previously calculated base-
line (details, see section 6.7.5).
P.peak
t.peak