9 display of the curves – Metrohm 746 VA Trace Analyzer User Manual
Page 112
4.2 Lead determination with standard addition
746 VA Trace Analyzer / 747 VA Stand
4-27
Method : TESTPb RESULTS
Determ.: 03201614 Calibrations
Substance Techn. Y.reg/offset Slope Nonlin. Mean.deviat.
ДДДДДДДДД
ДДДДДДДДД ДДДДДДДД
ДДДДДДДД ДДДДДДДДДДДД
ДДДДДДДДДДДД ДДДДДДДДДД
ДДДДДДДДДД ДДДДДДДДДД
ДДДДДДДДДД ДДДДДДДДДДДД
ДДДДДДДДДДДД
Pb std.add. -1.957e-07 -3.907e-05 2.137e-09
>>
Calcul.
>>
Eval.
•
You will find a brief explanation of the result data shown here in the
description of the full report in section 4.2.6.
4.2.9
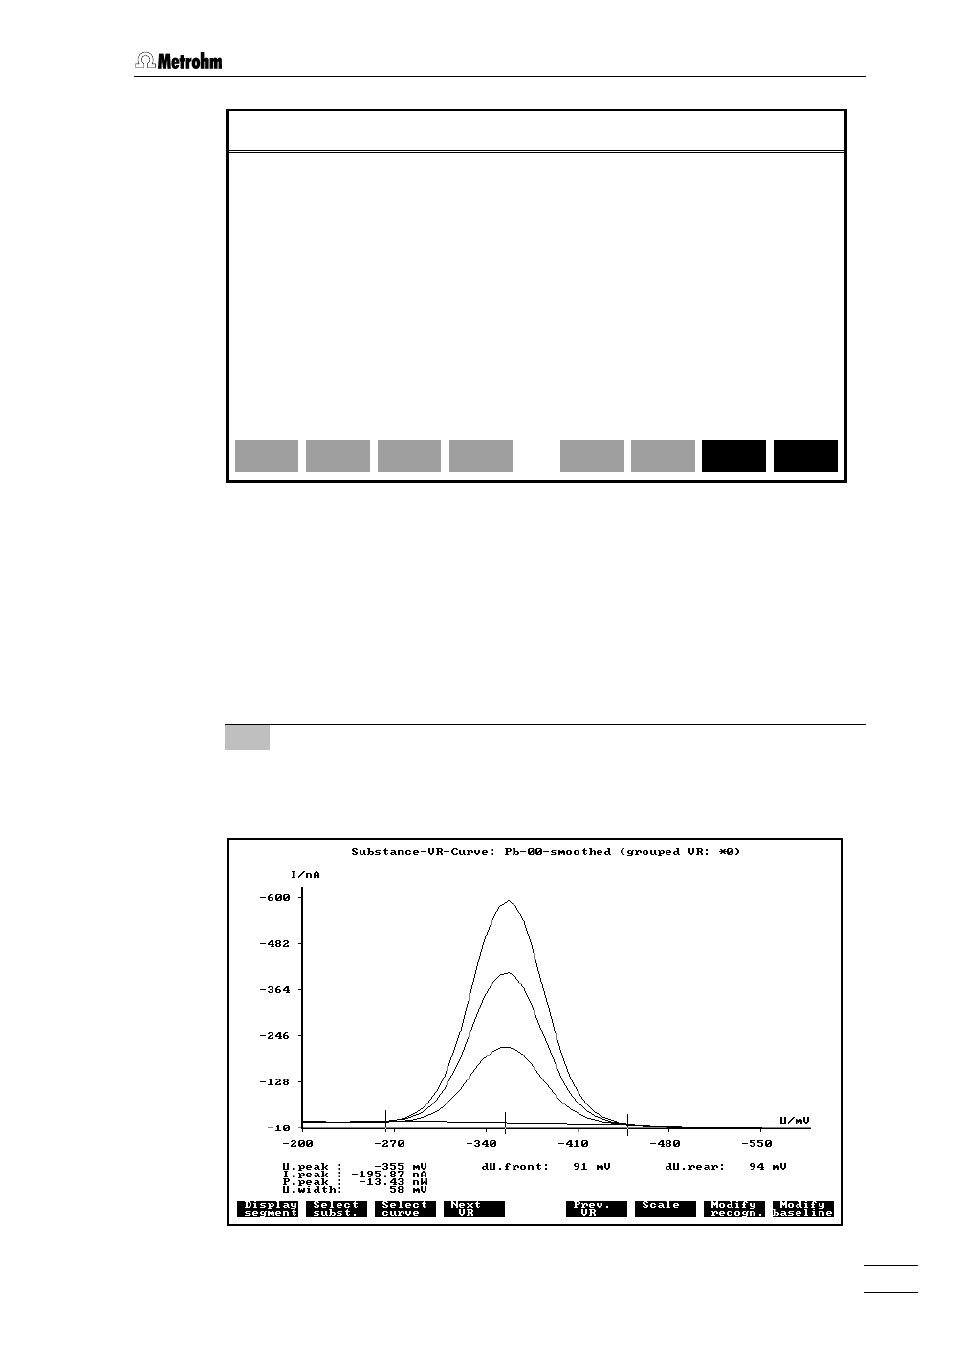
Display of the curves
The curves obtained in the recorded lead determination can not only be printed out,
but also shown on the screen. Proceed as follows:
1
Switch to dialog page "CURVES"
•
Press the yellow
showing three smoothed curves of the lead determination loaded in the
working storage:
- 915 KF Ti-Touch (382 pages)
- 800 Dosino (53 pages)
- 767 Calibrated Reference (23 pages)
- 940 Professional IC Vario ONE/SeS/Prep 2 (54 pages)
- 754 Dialysis Unit (49 pages)
- 815 Robotic Soliprep for LC (76 pages)
- Vision Manual (207 pages)
- tiamo 2.1 Manual (1532 pages)
- 825 Lab Link (37 pages)
- 808 Titrando (70 pages)
- 902 Titrando (52 pages)
- 756 KF Coulometer (163 pages)
- 756 KF Coulometer (162 pages)
- 940 Professional IC Vario ONE/LPG (98 pages)
- 850 Professional IC Anion MCS Prep 3 (154 pages)
- 850 Professional IC Anion MCS Prep 3 (152 pages)
- 904 Titrando (58 pages)
- 850 Professional IC Anion MSM-HC MCS Prep 2 (150 pages)
- 930 Compact IC Flex Oven/ChS/Deg (47 pages)
- 872 Extension Module Liquid handling (64 pages)
- 814 USB Sample Processor (90 pages)
- 814 USB Sample Processor (91 pages)
- 940 Professional IC Vario (43 pages)
- Vision – Tutorial (40 pages)
- 799 GPT Titrino (242 pages)
- 889 IC Sample Center (68 pages)
- 761 Compact IC (228 pages)
- 851 Titrando (100 pages)
- 748 DH Sample Changer (32 pages)
- 940 Professional IC Vario ONE/SeS/HPG (51 pages)
- 896 Professional Detector – Amperometry (62 pages)
- 877 Titrino plus (139 pages)
- 881 Compact IC pro – Anion (129 pages)
- 940 Professional IC Vario ONE/ChS/HPG (112 pages)
- 930 Compact IC Flex Deg (41 pages)
- 840 PC Control 5.0 / Touch Control (351 pages)
- 940 Professional IC Vario ONE/Prep 1 (45 pages)
- 776 Dosimat (42 pages)
- 717 Sample Changer (36 pages)
- 815 Robotic USB Sample Processor XL (113 pages)
- 815 Robotic USB Sample Processor XL (114 pages)
- 940 Professional IC Vario ONE/SeS/PP (126 pages)
- 838 Advanced Sample Processor Installation Instructions (109 pages)
- 700 Dosino (55 pages)
- 719 S Titrino (152 pages)