Metrohm 746 VA Trace Analyzer User Manual
Page 286
5.6.3 SUBSTANCES
746 VA Trace Analyzer / 747 VA Stand
5-135
Parameter
Range; Default value / Meaning
Display / Plot
display only
Display/plot (for measurement mode PSAMODE)
Title for those parameters which concern the display and plotting of
substance curves recorded with the measurement mode PSAMODE.
t/U.scale
auto, fixed; auto
Scaling of the y axis of PSA curves
The following two possibilities are available for scaling of the y axis of
PSA curves for the display and plotting of substance curves:
auto
Automatic scaling with matching to the measured
experimental values
fixed
Fixed scaling with the preset values
t/U.begin
and
t/U.end
If all measurement values are outside the y axis fixed with
t/U.scale
,
the y axis for printing the substance curve is scaled automatically. In
this case, the message
scale auto
is printed in the header line.
t/U.begin
-999.99...999.99 ns/V...s/V;
Initial value for scaling of the y axis of PSA curves
This parameter appears only if
t/U.scale = fixed
has been se-
lected.
If no value is entered for
t/U.begin
, the initial value is determined
automatically.
t/U.end
-999.99...999.99 ns/V...s/V;
Final value for scaling of the y axis of PSA curves
This parameter appears only if
t/U.scale = fixed
has been se-
lected.
If no value is entered for
t/U.end
, the final value is determined auto-
matically.
U.div
10 mV/cm...50 V/cm; 50 mV/cm
Division of the voltage axis
Division of the voltage axis in mV/cm for the plotting of substance
curves (not effective in display of the curves).
U.begin
-3000...3000 mV;
Initial value for scaling of voltage axis
If no value is entered for
U.begin
, the initial voltage
U.start
of the
sweep is taken as the initial value.
U.end
-3000...3000 mV;
Final value for scaling of voltage axis
If no value is entered for
U.end
, the final voltage
U.end
of the sweep
is taken as the final value.
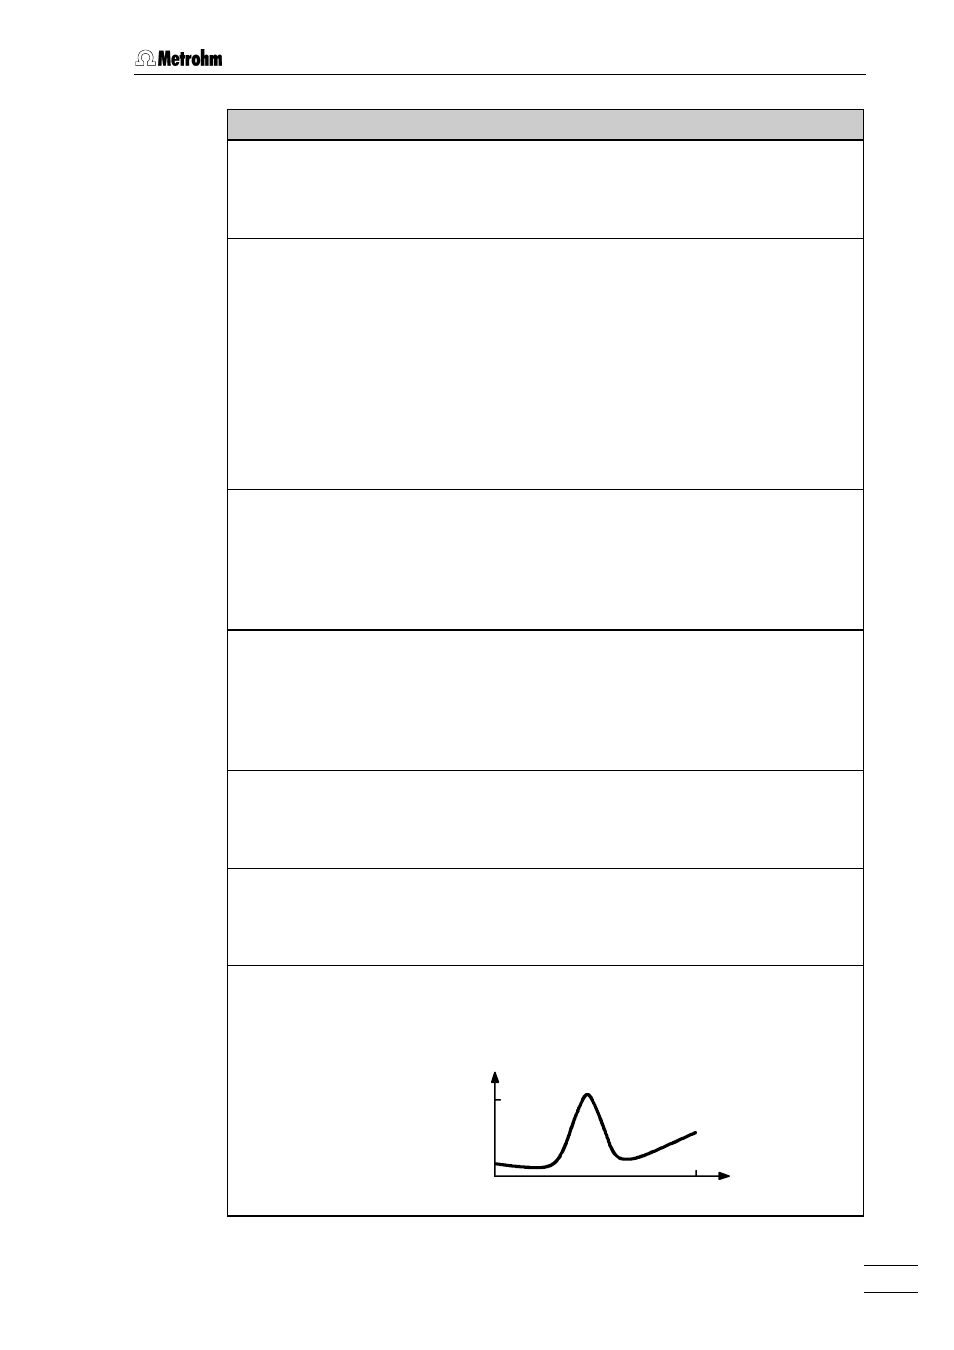
t/U.end
t/U.begin
U.begin
U.end