Metrohm 746 VA Trace Analyzer User Manual
Page 491
6 Data processing and evaluation
746 VA Trace Analyzer / 747 VA Stand
6-28
1
Measurement of the calibration solutions
The calibration solutions of known mass concentration
ρ
nn
are each meas-
ured several times. This gives:
EV
n
Evaluation quantity for n
th
calibration solution
EV
n
.mean
Mean value of the evaluation quantities for n
th
calibra-
tion solution
Std.dev.
Standard deviation of the n
th
individual value
EV
n
ρ
eff,s
eff,s
Effective mass concentrations of the calibration solu-
tions (calculated from
ρ
nn
taking the dilution into ac-
count)
2
Determination of the calibration curve
The parameters of the four possible model functions
y = a + bx
Straight line
y = bx
Straight line through zero point
y = a + bx + cx
4
Nonlinear curve of 4
th
degree
y = bx + cx
4
Nonlinear curve of 4
th
degree through zero point
are determined by the procedure described in section 6.9.3 with y =
EV
and
x =
ρ
eff
eff
by weighted least squares minimization. These parameters are
displayed on the "RESULTS/Calibrations" page and have the following
meaning:
a
Y.reg/offset
Intercept of calibration curve
b
Slope
Slope of calibration curve in the linear region
c
Nonlin.
Non-linearity factor
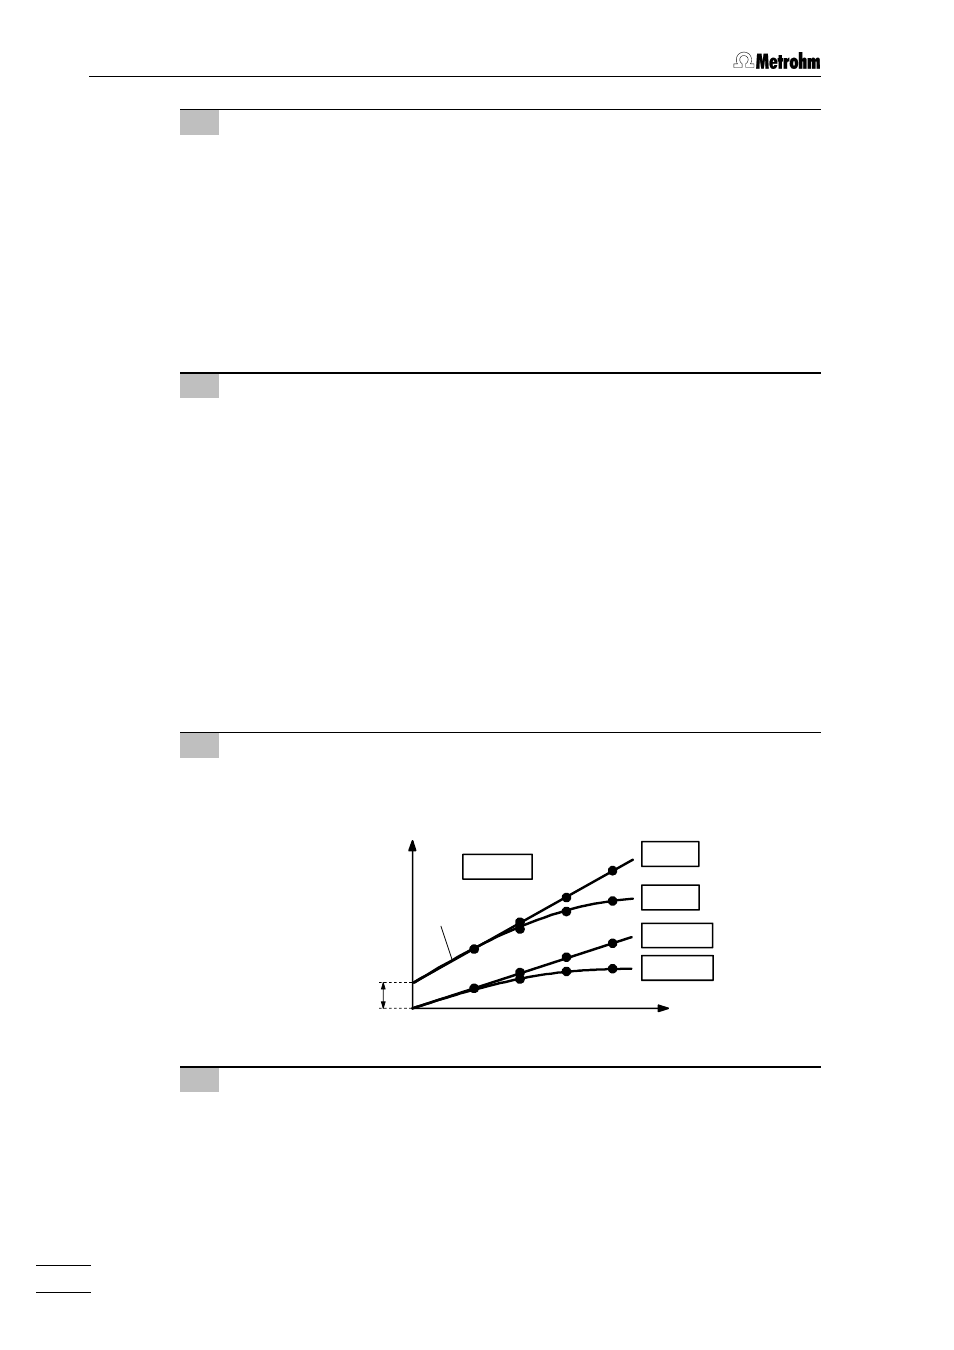
3
Display of the calibration curve
The calibration curve
EV
vs
ρ
eff
eff
is displayed and plotted by the 746 VA Trace
Analyzer:
Y.offset
EV
0
0
cal.crv.
linear
nonlin
0/linear
0/nonlin
Slope
4
Measurement of the sample solution
The sample solution with the unknown mass concentration
ρ
eff,s
eff,s
of the sam-
ple is measured one or more times. This gives:
EV
s
Evaluation quantity for sample
EV
s
.mean
Mean value of the evaluation quantity for sample
Std.dev.
Standard deviation of the individual value
EV
s
ρρ
eff
eff