4 using the data, 1 display the data in the line chart, Using the data -31 – IDEC High Performance Series User Manual
Page 869: Display the data in the line chart -31, Data log function, 4using the data
WindO/I-NV2 User’s Manual
14-31
4 Using the Data
14
Data Log Function
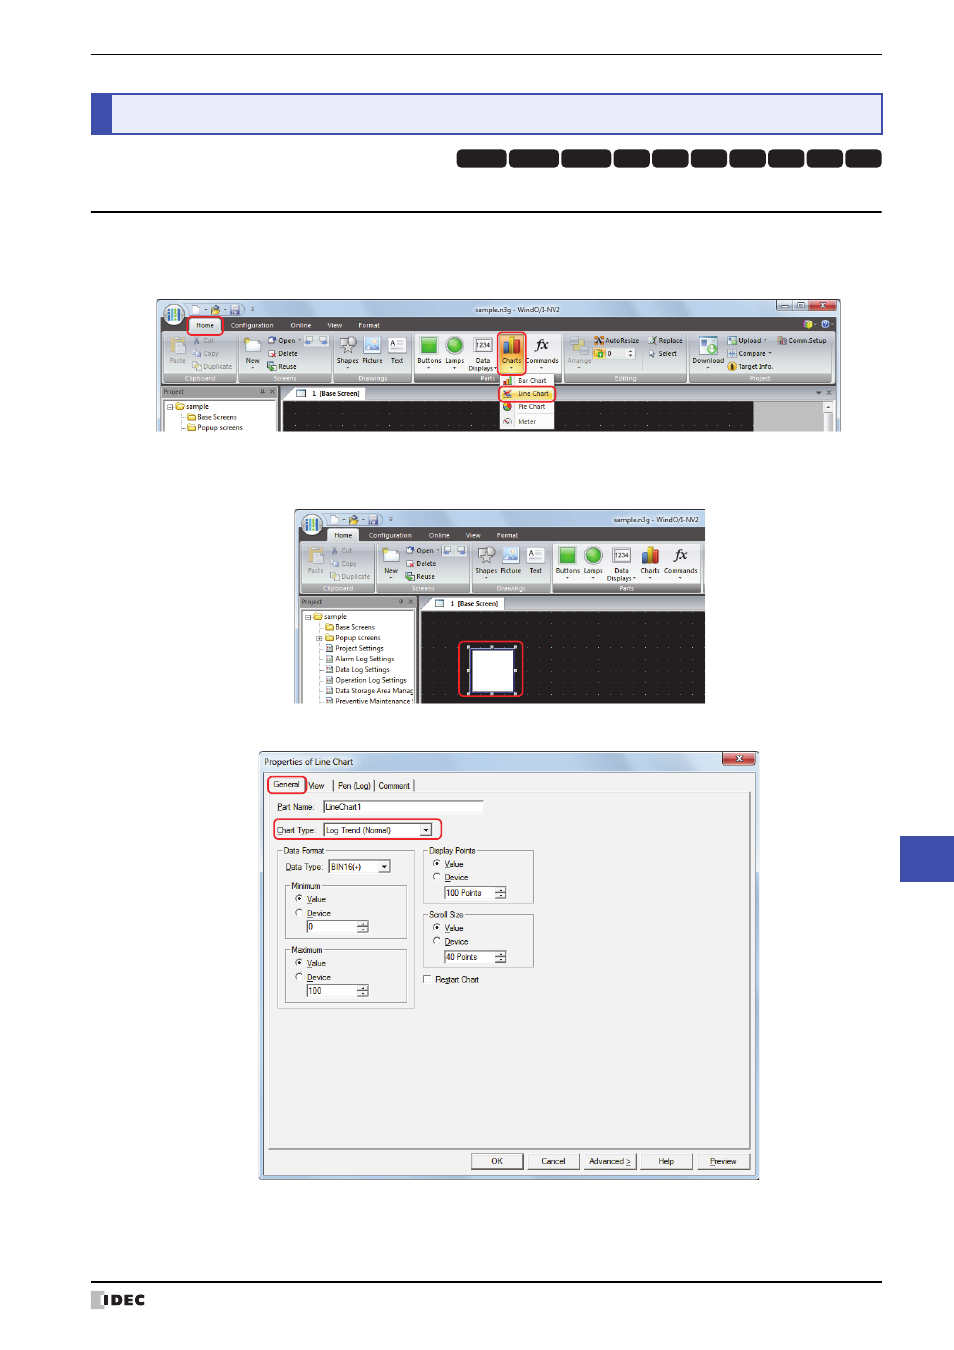
4.1 Display the Data in the Line Chart
You can display the sampled data in the Line Chart.
1
On the Home tab, in the Parts group, click Charts, and then click Line Chart.
2
Click a point on the edit screen where you wish to place the Line Chart.
3
Double-click the dropped Line Chart and a Properties dialog box will be displayed.
4
On the General tab, select Chart Type as Log Trend (Normal) or Log Trend (Pen Recorder).
4
Using the Data
HG3G
HG2G-5F
HG2G-5S
HG2G-S
HG4G HG1F HG2F HG2S HG3F HG4F
This manual is related to the following products: