Data over tab, Charts, Windo/i-nv2 user’s manual – IDEC High Performance Series User Manual
Page 705: 2 line chart
WindO/I-NV2 User’s Manual
11-33
2 Line Chart
11
Charts
●
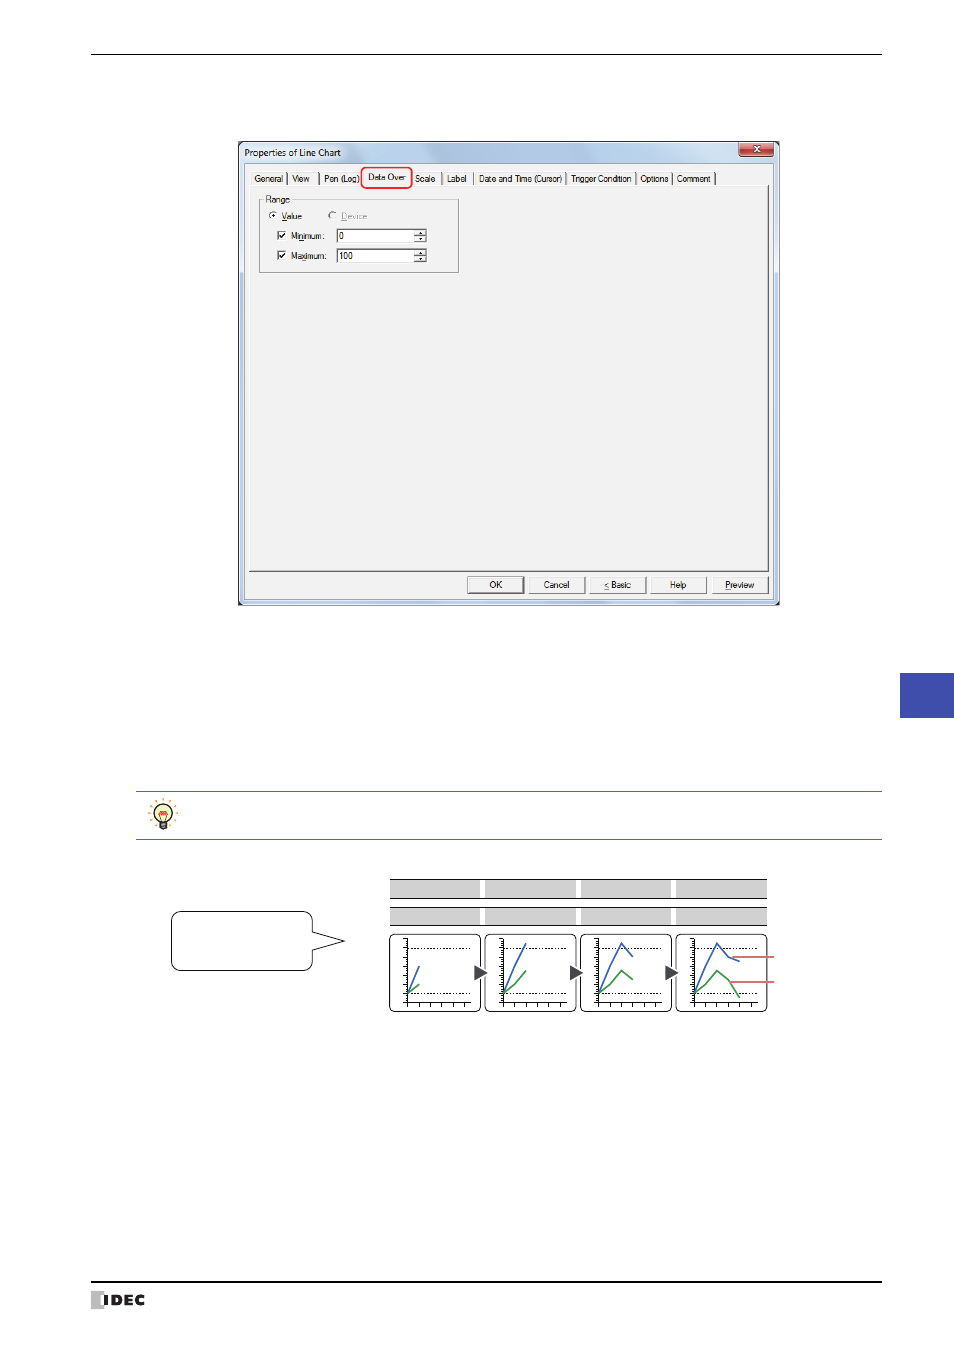
Data Over Tab
The Data Over tab is displayed in Advanced mode.
■
Range
The type of data is Value. This option uses constants for the allowable range.
Specifies the allowable range of values to display.
Minimum, Maximum: Select these check boxes to specify the minimum and/or maximum.
The minimum and maximum that can be specified differ according to the data type selected
with Data Format on the General tab. For details on data types, refer to Chapter 2 “1.2
Available Data” on page 2-2.
When grid lines are displayed for the minimum and maximum, select the Show Gridline check box on the
Scale tab and then select Data Over.
Ch1 data
60
Ch2 data
70
20
110
50
80
30
-10
Display
Range : Value
Minimum : 0
Maximum : 100
Ch1
Ch2
0
20
40
60
80
100
-20
120
0
20
40
60
80
100
-20
120
0
20
40
60
80
100
-20
120
0
20
40
60
80
100
-20
120