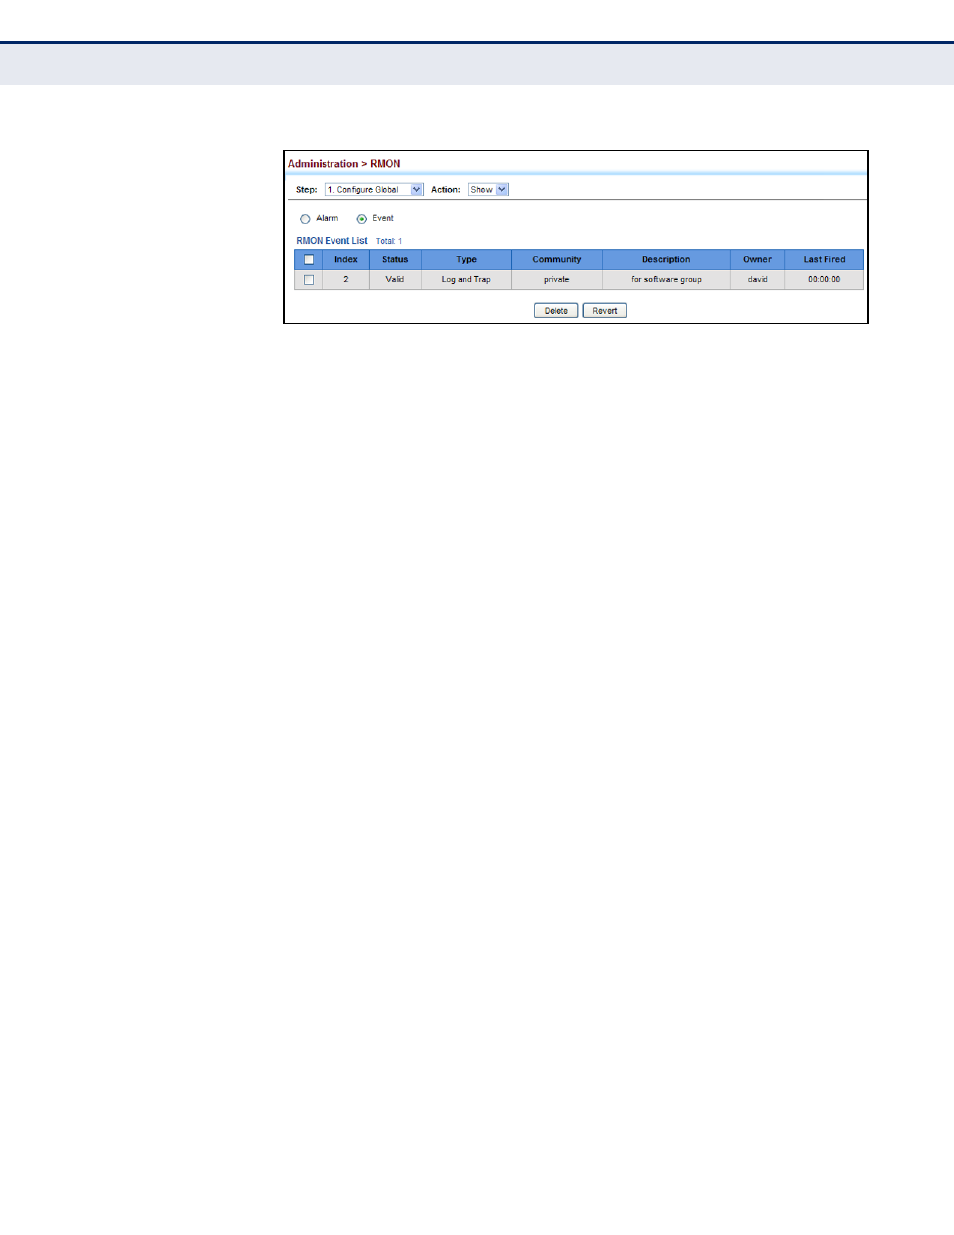
Configuring rmon history samples, Figure 251: showing configured rmon events – LevelOne GTL-2691 User Manual
Page 459

C
HAPTER
14
| Basic Administration Protocols
Remote Monitoring
– 459 –
Figure 251: Showing Configured RMON Events
C
ONFIGURING
RMON
H
ISTORY
S
AMPLES
Use the Administration > RMON (Configure Interface - Add - History) page
to collect statistics on a physical interface to monitor network utilization,
packet types, and errors. A historical record of activity can be used to track
down intermittent problems. The record can be used to establish normal
baseline activity, which may reveal problems associated with high traffic
levels, broadcast storms, or other unusual events. It can also be used to
predict network growth and plan for expansion before your network
becomes too overloaded.
CLI R
EFERENCES
◆
"Remote Monitoring Commands" on page 847
C
OMMAND
U
SAGE
◆
Each index number equates to a port on the switch.
◆
If history collection is already enabled on an interface, the entry must
be deleted before any changes can be made.
◆
The information collected for each sample includes:
input octets, packets, broadcast packets, multicast packets, undersize
packets, oversize packets, fragments, jabbers, CRC alignment errors,
collisions, drop events, and network utilization.
For a description of the statistics displayed on the Show Details page,
refer to
"Showing Port or Trunk Statistics" on page 168
.
P
ARAMETERS
These parameters are displayed:
◆
Port – The port number on the switch.
◆
Index - Index to this entry. (Range: 1-65535)
◆
Interval - The polling interval. (Range: 1-3600 seconds; Default: 1800
seconds)
◆
Buckets - The number of buckets requested for this entry.
(Range: 1-65536; Default: 50)
The number of buckets granted are displayed on the Show page.
