Displaying transceiver data, Figure 48 – Brocade 6910 Ethernet Access Switch Configuration Guide (Supporting R2.2.0.0) User Manual
Page 774
718
Brocade 6910 Ethernet Access Switch Configuration Guide
53-1002651-02
34
Port Configuration
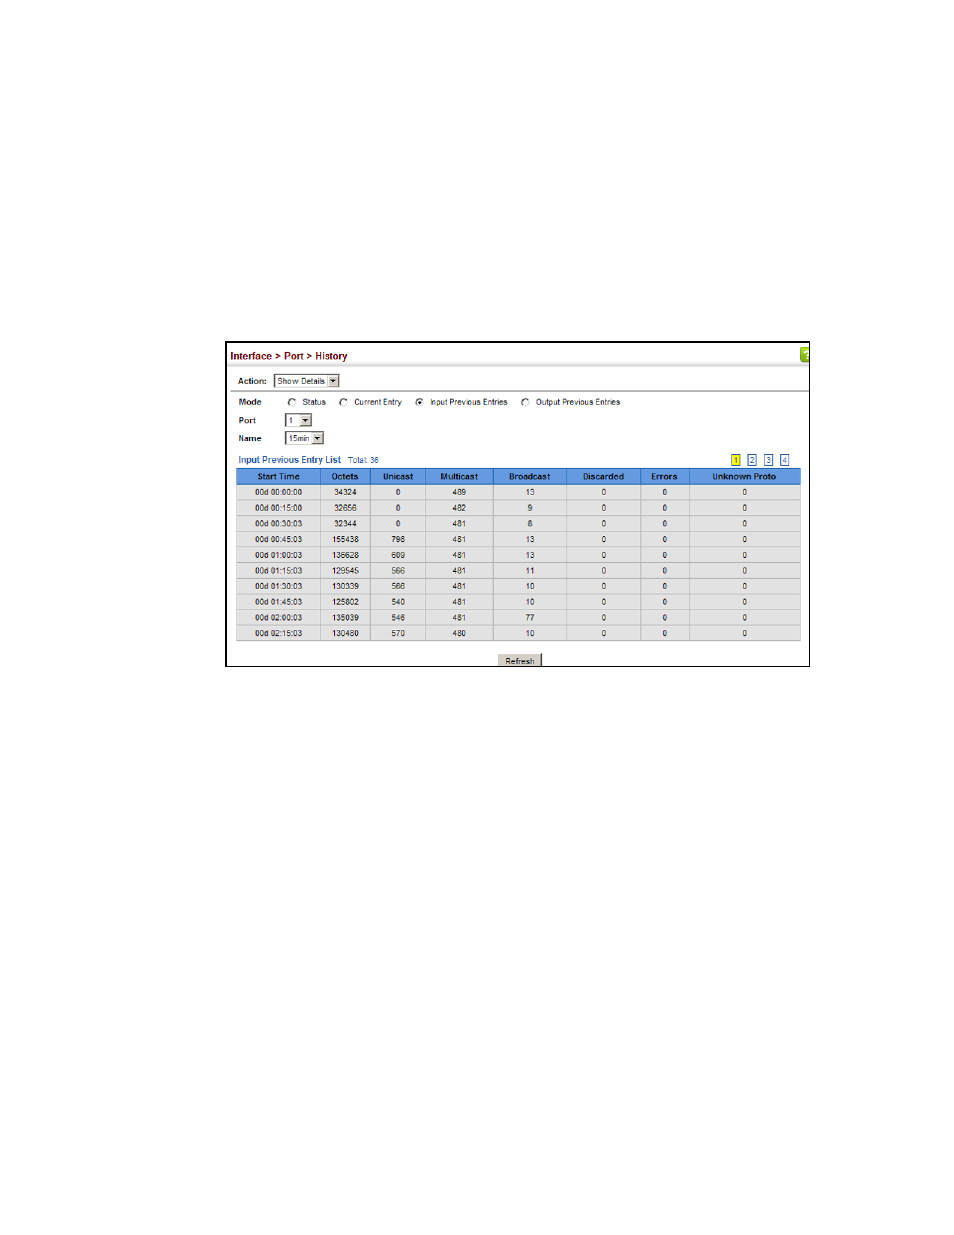
To show ingress or egress traffic statistics for a sample entry:
1. Click Interface, Port, Statistics, or Interface, Trunk, Statistics.
2. Select Show Details from the Action menu.
3. Select Input Previous Entry or Output Previous Entry from the options for Mode.
4. Select an interface from the Port or Trunk list.
5. Select an sampling entry from the Name list.
FIGURE 48
Showing Ingress Statistics for a History Sample
Displaying Transceiver Data
Use the Interface > Port > Transceiver (Show Information) page to display identifying information,
and operational for optical transceivers which support Digital Diagnostic Monitoring (DDM).
CLI References
•
Parameters
These parameters are displayed:
•
Port – Port number. (Range: 1-12)
•
General – Information on connector type and vendor-related parameters.
•
DDM Information – Information on temperature, supply voltage, laser bias current, laser power,
and received optical power.
The switch can display diagnostic information for SFP modules which support the SFF-8472
Specification for Diagnostic Monitoring Interface for Optical Transceivers. This information
allows administrators to remotely diagnose problems with optical devices. This feature,
referred to as Digital Diagnostic Monitoring (DDM) provides information on transceiver
parametersS.