Traffic statistics – Brocade Mobility Access Point System Reference Guide (Supporting software release 5.5.0.0 and later) User Manual
Page 778
768
Brocade Mobility Access Point System Reference Guide
53-1003100-01
13
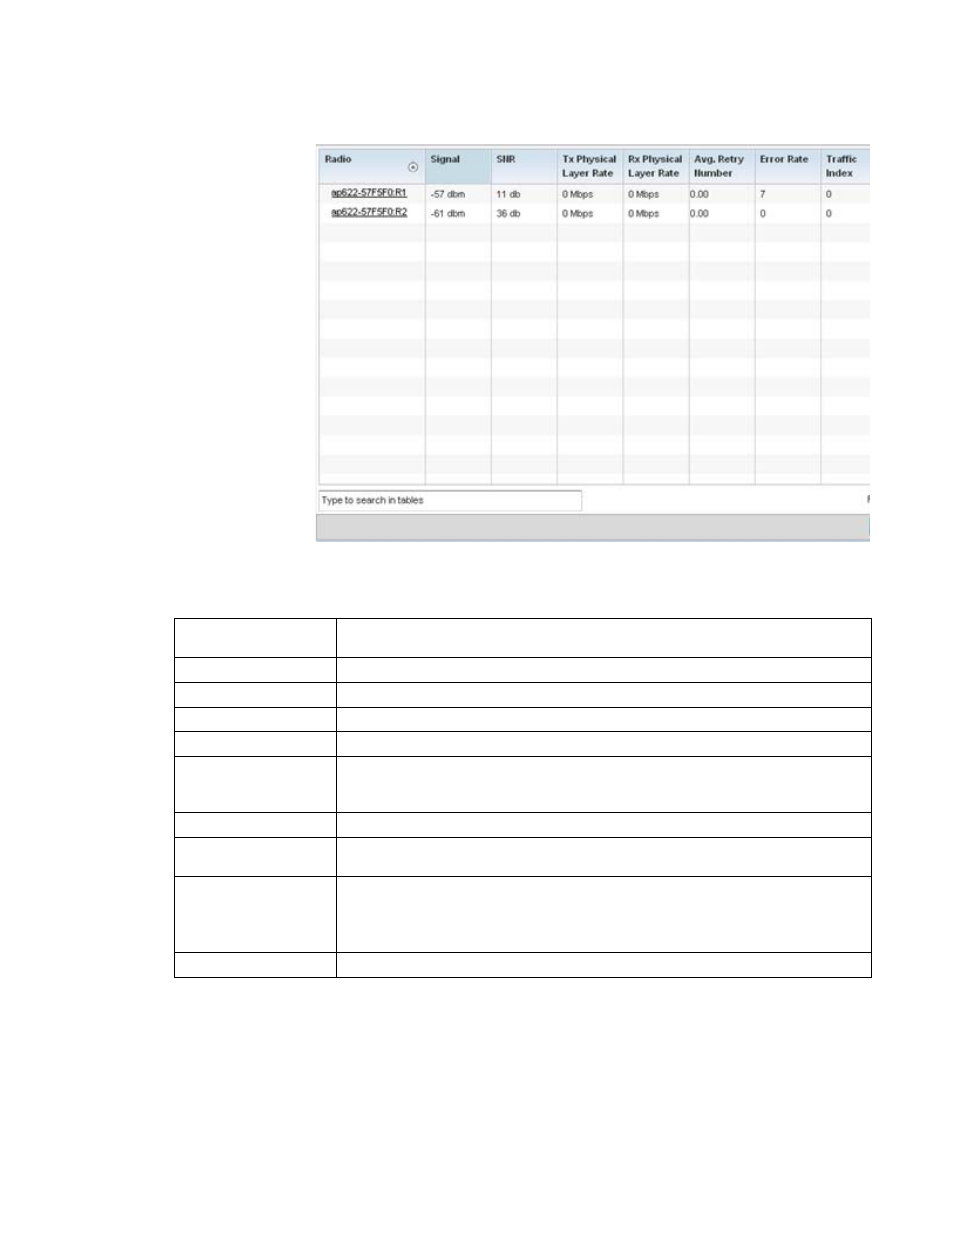
FIGURE 43
Access Point - Radio RF Statistics screen
The RF Statistics screen lists the following:
Traffic Statistics
Refer to the Traffic Statistics screen to review access point radio transmit and receive statistics,
data rate, and packets dropped during both transmit and receive operations.
To view the access point radio traffic statistics:
Radio
Displays the name assigned to the radio as its unique identifier. The name displays in the form
of a link that can be selected to launch a detailed screen containing radio throughout data.
Signal
Displays the radio’s current power level in - dBm.
SNR
Displays the signal to noise ratio of the radio’s associated wireless clients.
Tx Physical Layer Rate
Displays the data transmit rate for the radio’s physical layer. The rate is displayed in Mbps.
Rx Physical Layer Rate
Displays the data receive rate for the radio’s physical layer. The rate is displayed in Mbps.
Avg Retry Number
Displays the average number of retries per packet. A high number indicates possible network
or hardware problems. Assess the error rate in respect to potentially high signal and SNR
values to determine whether the error rate coincides with a noisy signal.
Error Rate
Displays the total number of received packets which contained errors for the listed radio.
Traffic Index
Displays the traffic utilization index of the radio. This is expressed as an integer value. 0 – 20
indicates very low utilization, and 60 and above indicate high utilization.
Quality Index
Displays an integer that indicates overall RF performance. The RF quality indices are:
•
0 – 50 (poor)
•
50 – 75 (medium)
•
75 – 100 (good)
Refresh
Select the Refresh
button to update the screen’s statistics counters to their latest values.