Brocade Mobility Access Point System Reference Guide (Supporting software release 5.5.0.0 and later) User Manual
Page 642
632
Brocade Mobility Access Point System Reference Guide
53-1003100-01
11
5. Refer to the following event parameters to assess nature and severity of the displayed event:
6. Select Clear All to clear the events displayed on this screen and begin a new event data
collection.
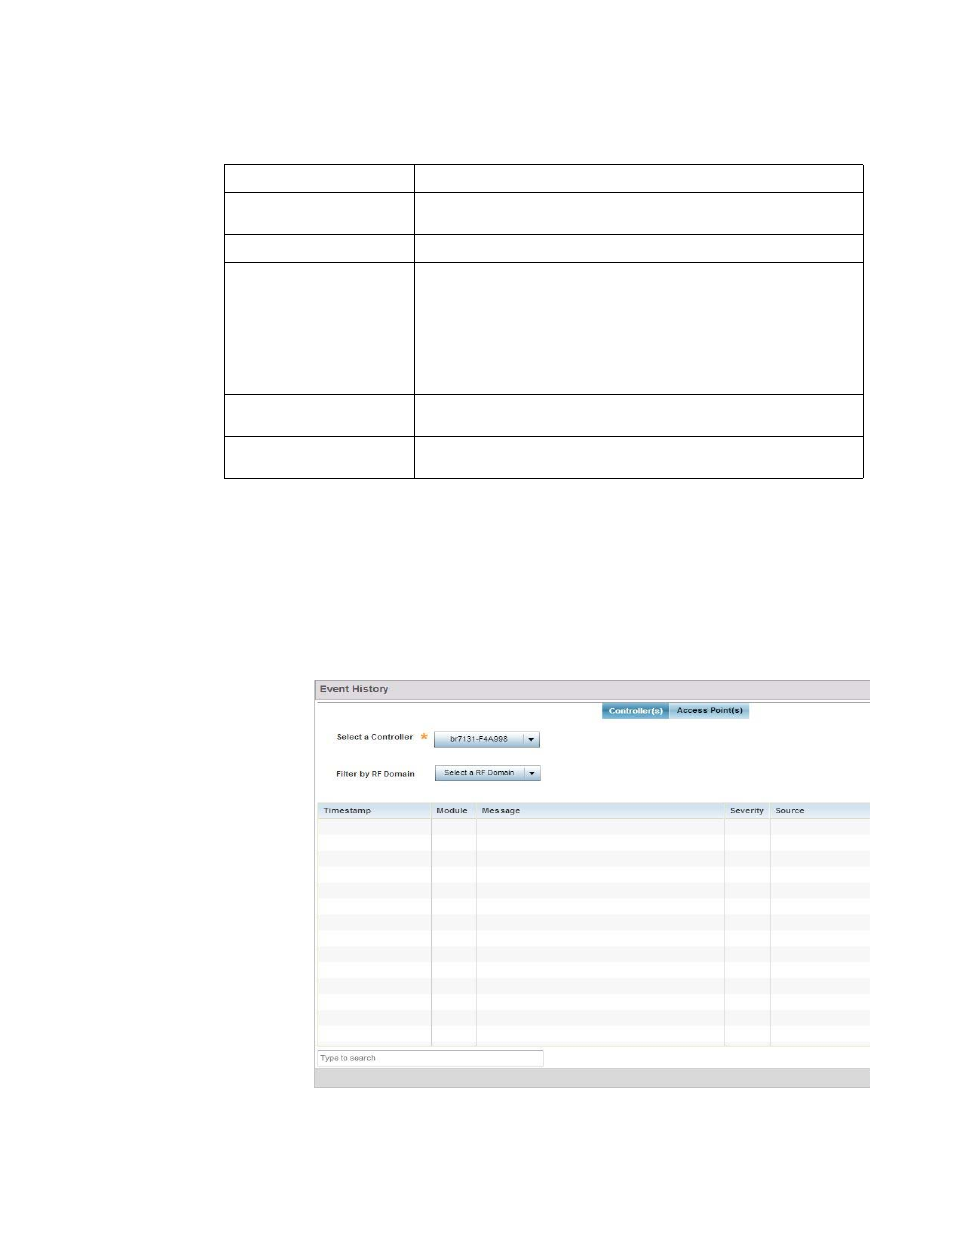
7. Select Event History from the upper, left-hand, side of the Fault Management browser.
The Event History screen displays events for both wireless controllers and access points. The
Controller(s) tab displays by default. Information on this tab can be filtered by controllers and then
further by the RF Domains on the selected controller. Similarly, the Access Point(s) tab displays
information for each RF Domain on the access point and this information can be further filtered on
the devices adopted by this access point.
FIGURE 3
Fault Management - Event History screen
Timestamp
Displays the timestamp (time zone specific) when the event occurred.
Module
Displays the module used to track the event. Events detected by other
modules are not tracked.
Message
Displays error or status messages for each event listed.
Severity
Displays the severity of the event as defined for tracking from the
Configuration screen. Severity options include:
•
All Severities – All events are displayed regardless of their severity
•
Critical – Only critical events are displayed
•
Error – Only errors are displayed
•
Warning – Only warnings are displayed
•
Informational – Only informational events are displayed
Source
Displays the MAC address of the source device tracked by the selected
module.
Hostname
Displays the hostname/IP address of the source device tracked by the
selected module.