Time series performance monitors – Brocade Network Advisor IP User Manual v12.1.0 User Manual
Page 332

278
Brocade Network Advisor IP User Manual
53-1002947-01
User-defined performance monitors
8
•
Refreshed — The time of the last update for the monitor.
To configure a distribution performance monitor, refer to
“Configuring a user-defined product
“Configuring a user-defined port performance monitor”
Accessing additional data from the Distribution monitors
•
Place the cursor on a bar in the graph to display the number of products included in the count
for the selected bar. For example, the tooltip “(Data Item 3, 22.6-33.8) = 6” means that there
are six products within the third percentage range (displays the temperatures within the
percentage range) for the selected measure (product temperature).
•
Double-click a percentage range to navigate to the Monitor_Title Distribution Data Details
dialog box. for more information, refer to
“Viewing product distribution data details”
“Viewing port distribution data details”
Time series performance monitors
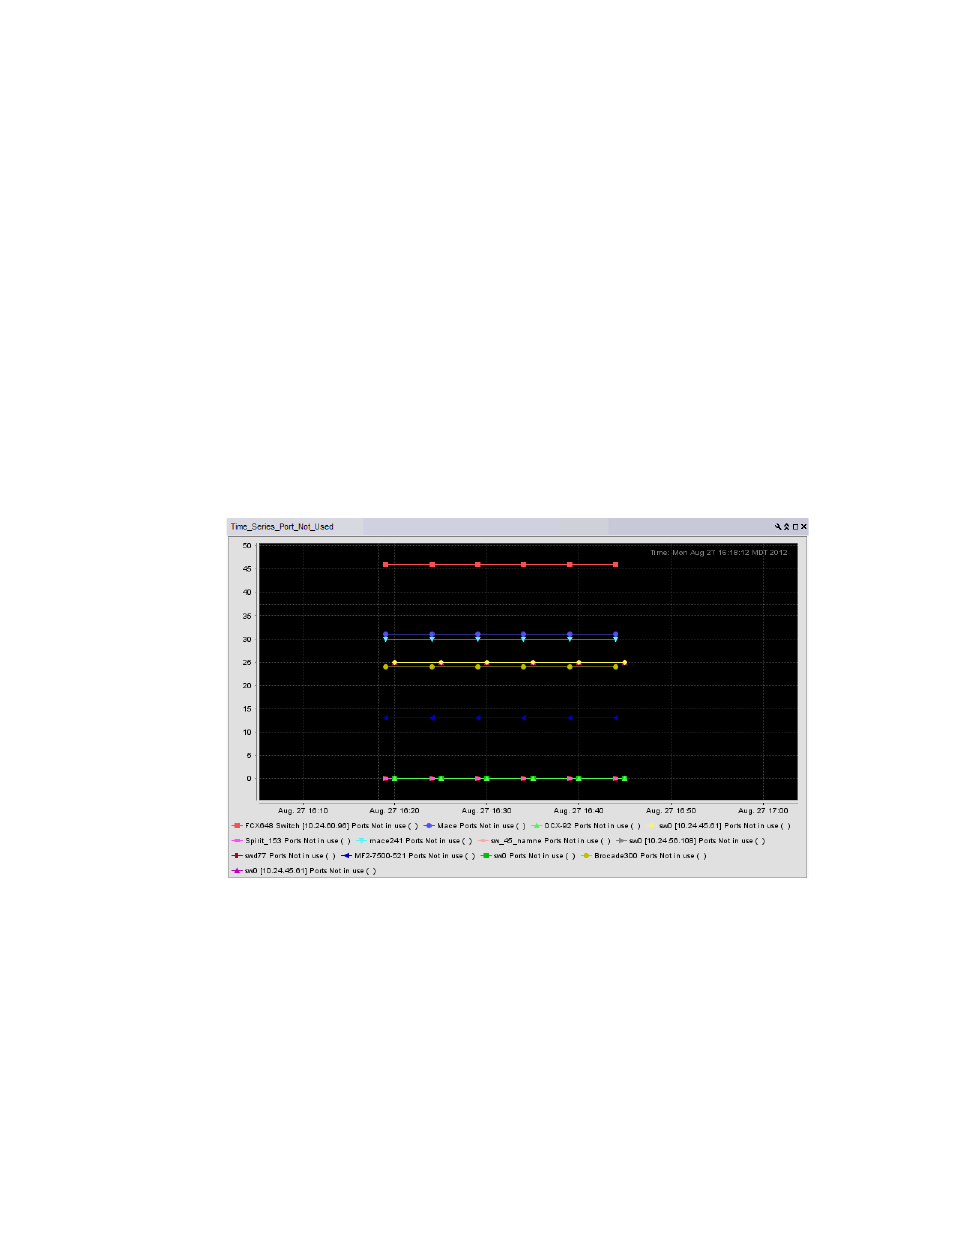
The time series performance monitors (
) display the selected measures in a chart.
FIGURE 112
Time series performance monitor example
The time series performance monitor includes the following data:
•
Monitor title — The user-defined monitor title.
•
Value (y-axis) — The number of objects affected by this monitor.
•
Time (x-axis) — The date and time the monitor collected the data.
•
Legend (below the x-axis) — The line color and the associated data that each line represents.
