Figure 81 – Brocade Network Advisor IP User Manual v12.1.0 User Manual
Page 278
224
Brocade Network Advisor IP User Manual
53-1002947-01
Dashboard overview
8
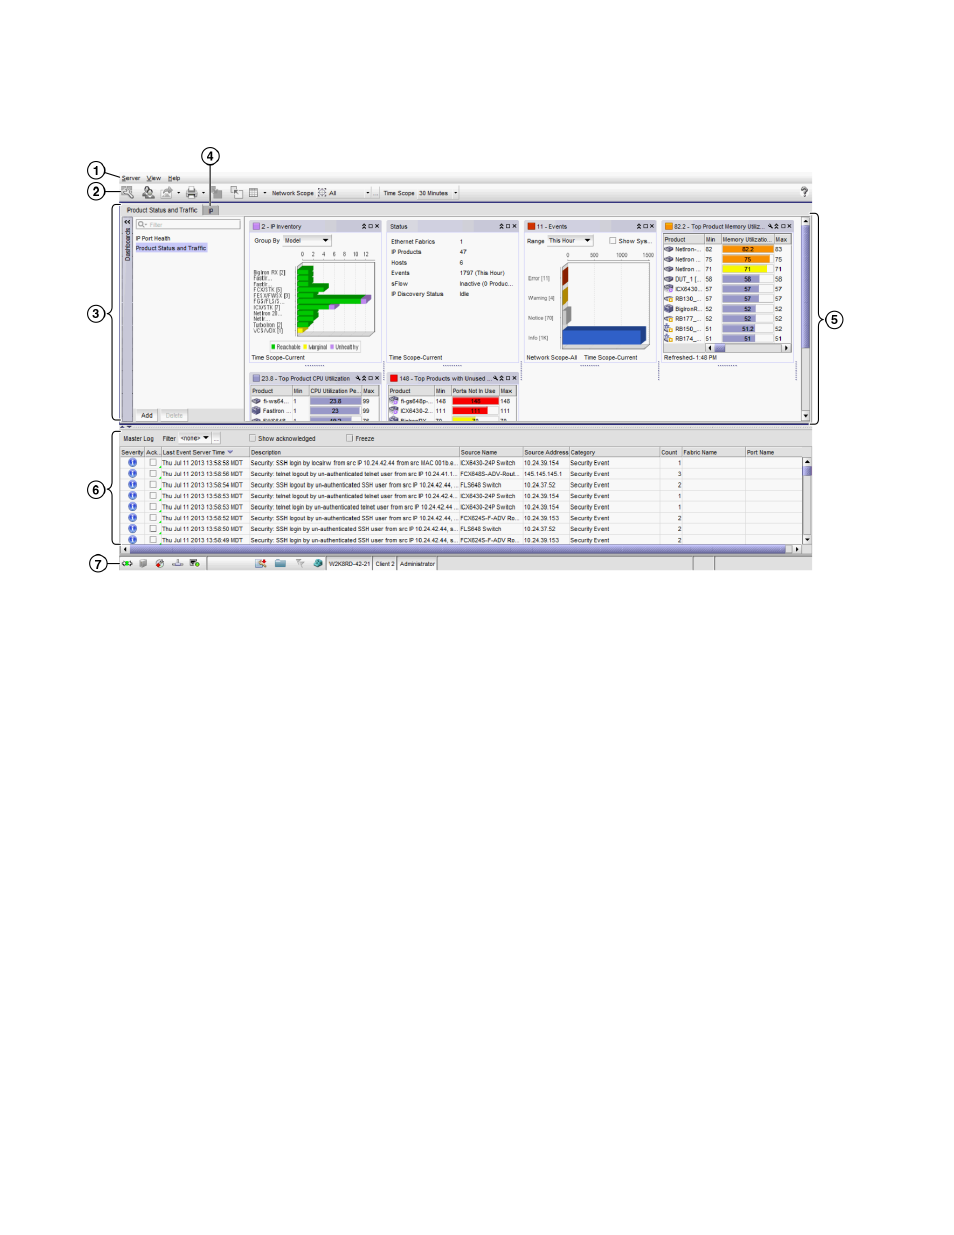
FIGURE 81
Dashboard tab
1. Menu bar — Lists commands you can perform on the dashboard. For a list of Dashboard tab
The dashboard also provides a shortcut menu to reset the dashboard back to the defaults.
Reset the dashboard back to the default settings by right-clicking in the white space and
selected Reset to Default.
2. Toolbar — Provides buttons that enable quick access to dialog boxes and functions. For a list of
Dashboard tab toolbar options, refer to
3. Dashboard tab — Provides a high-level overview of the network managed by Management
application server.
4. IP tab — Displays the Master Log, Minimap, Connectivity Map (topology), and Product List. For
more information, refer to the
.
5. Dashboard expand navigation bar — The expand navigation bar is located left of the status
widgets or performance monitors and provides a list of dashboards to choose from as well as
buttons to perform add and delete functions. For more information, refer to
6. Widgets — Displays operational status, inventory status, event summary, and overall network
or fabric status as well as performance monitors. For more information, refer to
7. Master Log — Displays all events that have occurred on the Management application. For more
information, refer to