Top or bottom product performance monitors – Brocade Network Advisor IP User Manual v12.1.0 User Manual
Page 328
274
Brocade Network Advisor IP User Manual
53-1002947-01
User-defined performance monitors
8
•
Port
-
Common
Port Utilization Percentage — The memory utilization percentage.
Traffic — The traffic in mbps.
CRC Errors — The number of CRC errors.
-
IP
Errors — The number of errors.
Discards — The number of discarded frames.
-
Wireless
Dropped Events — The number of dropped events.
MAC Errors — The number of MAC errors.
Back Packets Received — The number of bad packets received.
Tx Errors — The number of transmit errors.
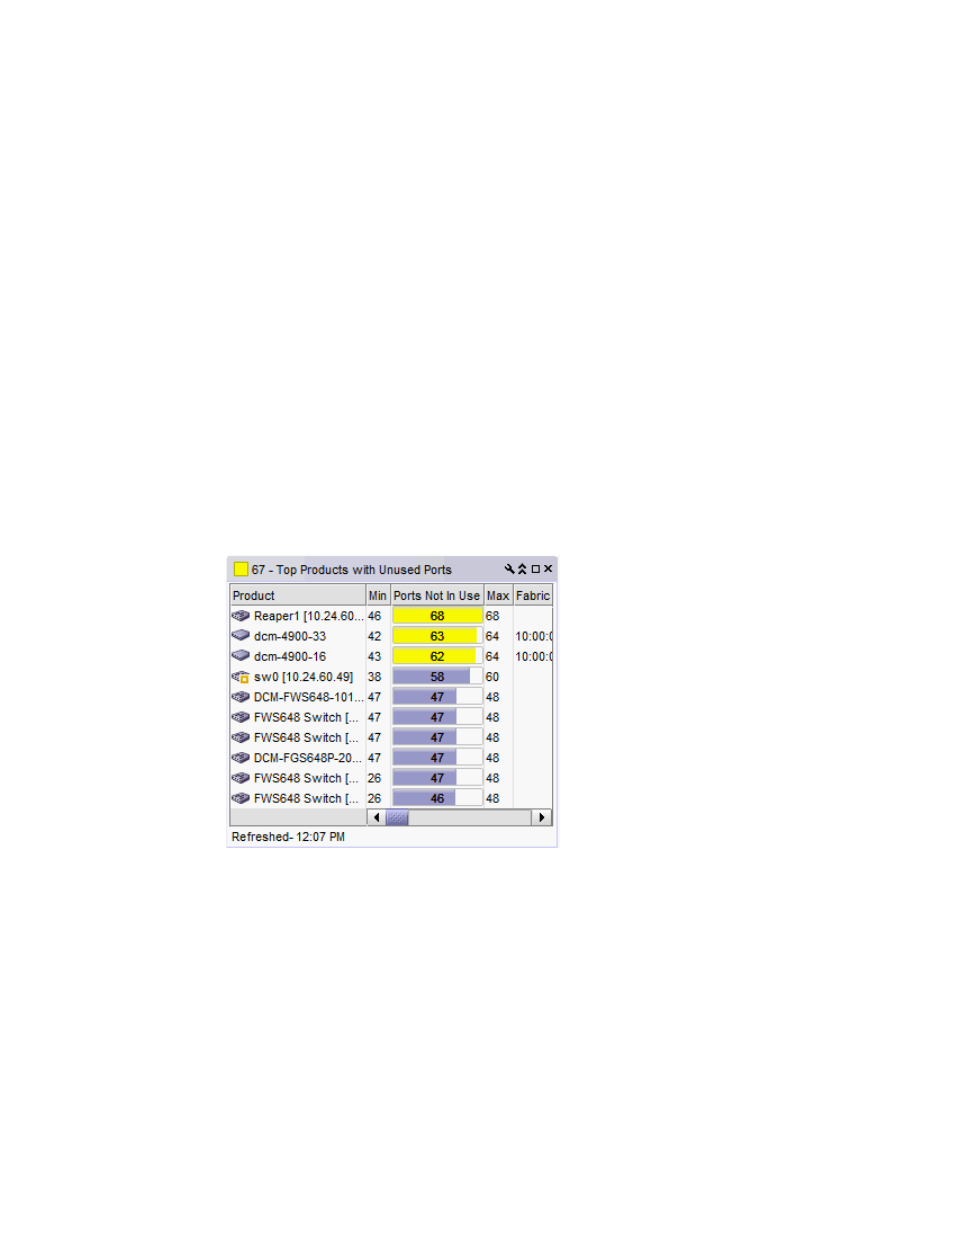
Top or bottom product performance monitors
The top or bottom product performance monitors (
) display the top or bottom number of
products (for example, top 10 products) for the selected measure in a table.
FIGURE 109
Top or bottom product performance monitor example
The top or bottom product performance monitor includes the following data:
•
Threshold icon/object count/monitor title — The color associated with the threshold and
number of objects within that threshold displays next to the monitor title.
•
Product — The product affected by this monitor.
•
Min — The minimum value of the measure in the specified time range.
•
Measure_Type — The percentage bar of the selected measure.
By default, products display sorted by the Measure_Type value (Top products sort from highest
to lowest and bottom products sort lowest to highest). Click a column head to sort the columns
by that value.